CVS 2004 Annual Report Download - page 47
Download and view the complete annual report
Please find page 47 of the 2004 CVS annual report below. You can navigate through the pages in the report by either clicking on the pages listed below, or by using the keyword search tool below to find specific information within the annual report.-
 1
1 -
2
-
3
-
4
-
5
-
6
-
7
-
8
-
9
-
10
-
11
-
12
-
13
-
14
-
15
-
16
-
17
-
18
-
19
-
20
-
21
-
22
-
23
-
24
-
25
-
26
-
27
-
28
-
29
-
30
-
31
-
32
-
33
-
34
-
35
-
36
-
 37
37 -
 38
38 -
 39
39 -
 40
40 -
 41
41 -
 42
42 -
 43
43 -
 44
44 -
 45
45 -
 46
46 -
 47
47 -
 48
48 -
 49
49 -
 50
50 -
 51
51 -
 52
52
 |
 |
CVS Corporation 2004 Annual Report | 45
12 ²
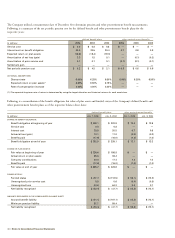
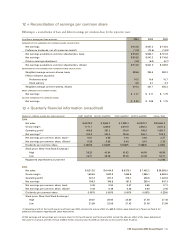
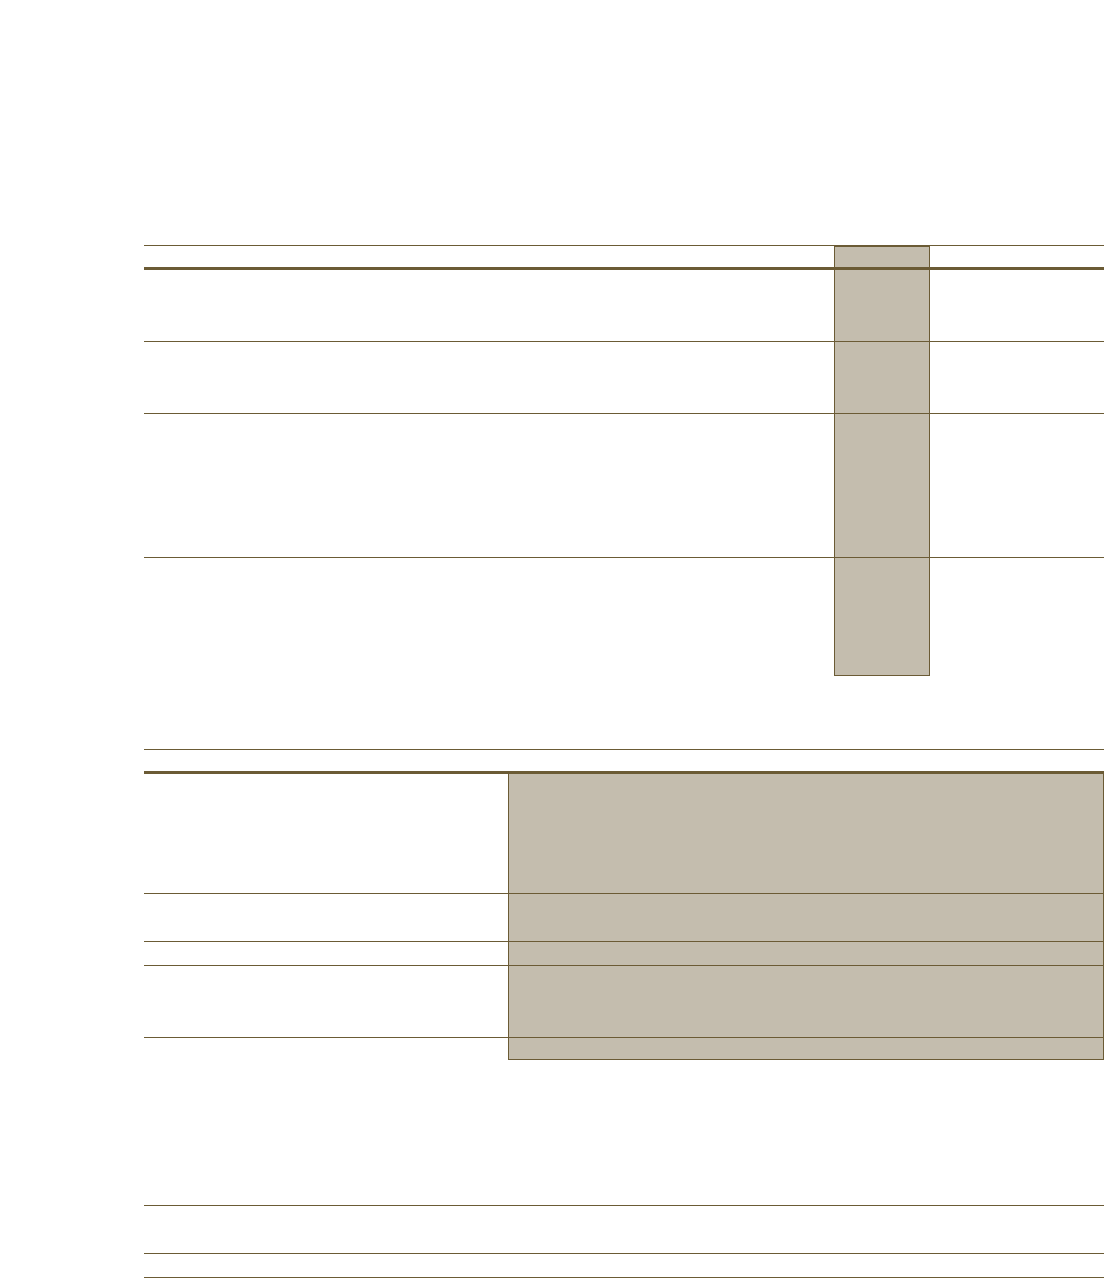
²Reconciliation of earnings per common share
Following is a reconciliation of basic and diluted earnings per common share for the respective years:
In millions, except per share amounts 2004 2003 2002
NUMERATOR FOR EARNINGS PER COMMON SHARE CALCULATION:
Net earnings $ 918.8 $ 847.3 $ 716.6
Preference dividends, net of income tax benefit (14.2) (14.6) (14.8)
Net earnings available to common shareholders, basic $ 904.6 $ 832.7 $ 701.8
Net earnings $ 918.8 $ 847.3 $ 716.6
Dilutive earnings adjustment (5.2) (6.3) (6.7)
Net earnings available to common shareholders, diluted $ 913.6 $ 841.0 $ 709.9
DENOMINATOR FOR EARNINGS PER COMMON SHARE CALCULATION:
Weighted average common shares, basic 398.6 394.4 392.3
Effect of dilutive securities:
Preference stock 10.2 10.6 10.7
Stock options 6.6 2.7 2.3
Weighted average common shares, diluted 415.4 407.7 405.3
BASIC EARNINGS PER COMMON SHARE:
Net earnings $ 2.27 $ 2.11 $ 1.79
DILUTED EARNINGS PER COMMON SHARE:
Net earnings $ 2.20 $ 2.06 $ 1.75
13 ²
²Quarterly financial information (unaudited)
Dollars in millions, except per share amounts FIRST QUARTER SECOND QUARTER THIRD QUARTER FOURTH QUARTER FISCAL YEAR
2004:
Net sales $ 6,818.6 $ 6,943.1 $ 7,909.4 $ 8,923.2 $ 30,594.3
Gross margin 1,771.7 1,826.5 2,070.8 2,362.2 8,031.2
Operating profit(1) 405.6 387.2 316.0 345.9 1,454.7
Net earnings(2) 244.6 234.5 184.6 255.1 918.8
Net earnings per common share, basic(2) 0.61 0.58 0.45 0.63 2.27
Net earnings per common share, diluted(2) 0.59 0.56 0.44 0.61 2.20
Dividends per common share 0.06625 0.06625 0.06625 0.06625 0.2650
Stock price: (New York Stock Exchange)
High 38.23 42.64 43.63 46.90 46.90
Low 34.21 36.46 39.06 42.28 34.21
Registered shareholders at year-end 11,720
2003:
Net sales $ 6,312.8 $ 6,444.9 $ 6,378.1 $ 7,452.2 $ 26,588.0
Gross margin 1,605.5 1,633.8 1,658.6 1,965.1 6,863.0
Operating profit 331.3 337.0 316.7 438.6 1,423.6
Net earnings 196.3 199.8 187.8 263.4 847.3
Net earnings per common share, basic 0.49 0.50 0.47 0.66 2.11
Net earnings per common share, diluted 0.48 0.49 0.46 0.64 2.06
Dividends per common share 0.0575 0.0575 0.0575 0.0575 0.2300
Stock price: (New York Stock Exchange)
High 26.67 28.50 32.60 37.46 37.46
Low 21.99 23.08 27.43 31.06 21.99
(1) Operating profit for the fourth quarter and fiscal year 2004, includes the pre-tax effect of a $65.9 million Lease Adjustment. Please see Note 5 for
additional information regarding the Lease Adjustment.
(2) Net earnings and net earnings per common share for the fourth quarter and fiscal year 2004, include the after-tax effect of the Lease Adjustment
discussed in (1) above, and the reversal of $60.0 million of previously recorded tax reserves as discussed in Note 10 above.