CVS 2004 Annual Report Download - page 20
Download and view the complete annual report
Please find page 20 of the 2004 CVS annual report below. You can navigate through the pages in the report by either clicking on the pages listed below, or by using the keyword search tool below to find specific information within the annual report.-
 1
1 -
2
-
3
-
4
-
5
-
6
-
7
-
8
-
9
-
 10
10 -
 11
11 -
 12
12 -
 13
13 -
 14
14 -
 15
15 -
 16
16 -
 17
17 -
 18
18 -
 19
19 -
 20
20 -
 21
21 -
 22
22 -
 23
23 -
 24
24 -
 25
25 -
 26
26 -
 27
27 -
 28
28 -
 29
29 -
 30
30 -
31
-
32
-
33
-
34
-
35
-
36
-
37
-
38
-
39
-
40
-
41
-
42
-
43
-
44
-
45
-
46
-
47
-
48
-
49
-
50
-
51
-
52
 |
 |

The following discussion should be read in conjunction with our
audited consolidated financial statements and our Cautionary
Statement Concerning Forward-Looking Statements that are
presented in this Annual Report.
OUR BUSINESS
Our Company is a leader in the retail drugstore industry
in the United States. We sell prescription drugs and a wide
assortment of general merchandise, including over-the-counter
drugs, beauty products and cosmetics, film and photofinishing
services, seasonal merchandise, greeting cards and convenience
foods through our CVS/pharmacy®retail stores and online
through CVS.com.
®We also provide pharmacy benefit
management, mail order services and specialty pharmacy
services through PharmaCare Management Services and
PharmaCare Pharmacy®stores. As of January 1, 2005,
we operated 5,375 retail and specialty pharmacy stores
in 36 states and the District of Columbia.
ACQUISITION
OnJuly 31, 2004, the Company acquired certain assets and
assumed certain liabilities from J.C. Penney Company, Inc.
and certain of its subsidiaries, including Eckerd Corporation
(“Eckerd”). The acquisition included 1,268 Eckerd retail
drugstores and Eckerd Health Services, which includes Eckerd’s
mail order and pharmacy benefit management businesses
(collectively, the “Acquired Businesses”). The Company believes
that the acquisition of the Acquired Businesses is consistent with
its long-term strategy of expanding its retail drugstore business
in high-growth markets and increasing the size and product
offerings of its pharmacy benefit management business.
The purchase price under the Asset Purchase Agreement is
$2.15 billion, which was adjusted for estimated working capital
at closing. The final purchase price is subject to adjustment
based on the final working capital of the Acquired Businesses
as of the closing date. The Company anticipates that the
adjustment to the purchase price will be finalized during
fiscal 2005. The Company obtained funding for the acquisition
through a combination of cash and commercial paper and
subsequently repaid a portion of the commercial paper used
to fund the acquisition with the proceeds received from the
issuance of $650 million of 4.0% unsecured senior notes due
September 15, 2009 and $550 million of 4.875% unsecured
senior notes due September 15, 2014.
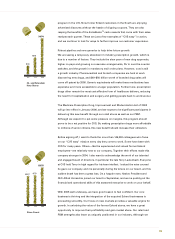
During the twelve months preceding the acquisition of the
Acquired Businesses, the sales performance of the acquired
stores declined significantly. We believe the decline in
performance is attributable to, among other things, ineffective
pricing, promotional and merchandising strategies, as well as
poor operational execution.
As a result, we believe the acquired stores should benefit
considerably from our leading-edge technology and expertise
in important areas such as merchandising, logistics, customer
service and marketing. We have begun to implement a wide
range of initiatives designed to improve sales, build customer
loyalty and improve inventory management. We cannot, however,
guarantee these initiatives will produce the desired
improvements. Please see Note 2 to our consolidated financial
statements for further information on the Acquired Businesses.
RESULTS OF OPERATIONS AND INDUSTRY ANALYSIS
The Company’s fiscal year is a 52 or 53 week period ending on
the Saturday nearest to December 31. Fiscal 2004, which ended
on January 1, 2005, and fiscal 2002, which ended on December
28, 2002, each included 52 weeks. Fiscal 2003, which ended on
January 3, 2004, included 53 weeks. Unless otherwise noted, all
references to years relate to these fiscal years.
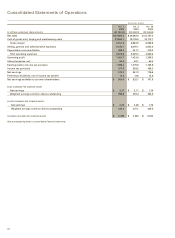
Net sales–The following table summarizes our sales performance:
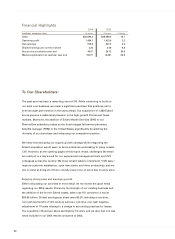
2004 2003 2002
Net sales (in billions) $30.6 $ 26.6 $ 24.2
Net sales increase:
Total 15.1% 10.0% 8.7%
Pharmacy 17.1% 11.9% 11.2%
Front store 10.5% 5.7% 3.8%
Same store
sales increase:(1)
Total 5.5% 5.8% 8.4%
Pharmacy 7.0% 8.1% 11.7%
Front store 2.3% 1.2% 2.3%
Pharmacy % of total sales 70.0% 68.8% 67.6%
Thirdparty % of
pharmacy sales 94.1% 93.2% 92.3%
Prescriptions filled
(in millions) 366 335 316
(1) Same store sales do not include the sales results of the stores acquired
on July 31, 2004. The acquired stores will be included in same store sales
following the one-year anniversary of the acquisition, beginning in fiscal
August 2005.
As you review our net sales performance, we believe you should
consider the following important information:
²Total net sales from the Acquired Businesses accounted for
approximately 970 basis points of our total net sales increase
in 2004.
²Total net sales from new stores accounted for approximately
190 basis points of our total net sales increase in 2004 and
350 basis points in 2003.
²Total net sales continued to benefit from our ongoing
relocation program, which moves existing in-line shopping
center stores to larger, more convenient, freestanding
locations. Historically, we have achieved significant
improvements in customer count and net sales when
Management’s Discussion and Analysis of Financial Condition
and Results of Operation
18