CVS 2004 Annual Report Download - page 36
Download and view the complete annual report
Please find page 36 of the 2004 CVS annual report below. You can navigate through the pages in the report by either clicking on the pages listed below, or by using the keyword search tool below to find specific information within the annual report.-
 1
1 -
2
-
3
-
4
-
5
-
6
-
7
-
8
-
9
-
10
-
11
-
12
-
13
-
14
-
15
-
16
-
17
-
18
-
19
-
20
-
21
-
22
-
23
-
24
-
25
-
 26
26 -
 27
27 -
 28
28 -
 29
29 -
 30
30 -
 31
31 -
 32
32 -
 33
33 -
 34
34 -
 35
35 -
 36
36 -
 37
37 -
 38
38 -
 39
39 -
 40
40 -
 41
41 -
 42
42 -
 43
43 -
 44
44 -
 45
45 -
 46
46 -
47
-
48
-
49
-
50
-
51
-
52
 |
 |

insurance industry actuarial assumptions and the Company’s
historical claims experience.
Stock-based compensation–The Company accounts for its
stock-based compensation plans under the recognition and
measurement principles of Accounting Principles Board (“APB”)
Opinion No. 25, “Accounting for Stock Issued to Employees,”
and related interpretations. As such, no stock-based employee
compensation cost is reflected in net earnings for options
granted under those plans since they had an exercise price
equal to the market value of the underlying common stock
on the date of grant. See Note 8 for further information on
stock-based compensation.
34 | Notes to Consolidated Financial Statements
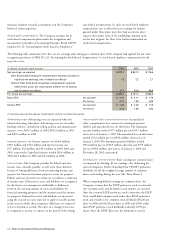
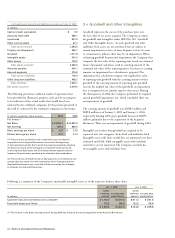
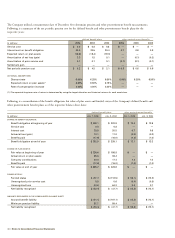
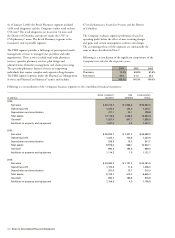
The following table summarizes the effect on net earnings and earnings per common share if the company had applied the fair value
recognition provisions of SFAS No. 123, “Accounting for Stock-Based Compensation,” to stock-based employee compensation for the
respective years:
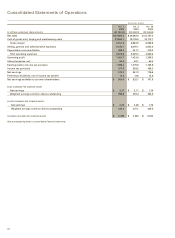
In millions, except per share amounts 2004 2003 2002
Net earnings, as reported $ 918.8 $ 847.3 $ 716.6
Add: Stock-based employee compensation expense included in
reported net earnings, net of related tax effects(1) 1.5 2.2 2.7
Deduct: Total stock-based employee compensation expense
determined under fair value based method for all awards,
net of related tax effects 40.2 52.4 56.8
Pro forma net earnings $ 880.1 $ 797.1 $ 662.5
Basic EPS: As reported $ 2.27 $ 2.11 $ 1.79
Pro forma 2.17 1.98 1.65
Diluted EPS: As reported $ 2.20 $ 2.06 $ 1.75
Pro forma 2.11 1.95 1.62
(1) Amounts represent the after-tax compensation costs for restricted stock grants.
Advertising costs–Advertising costs are expensed when the
related advertising takes place. Advertising costs, net of vendor
funding, which is included in selling, general and administrative
expenses, were $205.7 million in 2004, $178.2 million in 2003
and $152.2 million in 2002.
Interest expense, net–Interest expense was $64.0 million,
$53.9 million and $54.5 million and interest income was
$5.7 million, $5.8 million and $4.1 million in 2004, 2003 and
2002, respectively. Capitalized interest totaled $10.4 million in
2004, $11.0 million in 2003 and $6.1 million in 2002.
Income taxes–The Company provides for federal and state
income taxes currently payable, as well as for those deferred
because of timing differences between reporting income and
expenses for financial statement purposes versus tax purposes.
Federal and state incentive tax credits are recorded as a reduction
of income taxes. Deferred tax assets and liabilities are recognized
for the future tax consequences attributable to differences
between the carrying amount of assets and liabilities for
financial reporting purposes and the amounts used for income
tax purposes. Deferred tax assets and liabilities are measured
using the enacted tax rates expected to apply to taxable income
in the years in which those temporary differences are expected
to be recoverable or settled. The effect of a change in tax rates
is recognized as income or expense in the period of the change.
Accumulated other comprehensive loss–Accumulated
other comprehensive loss consists of a minimum pension
liability and unrealized losses on derivatives. The minimum
pension liability totaled $57.7 million pre-tax ($35.7 million
after-tax) as of January 1, 2005. The unrealized loss on derivatives
totaled $31.2 million pre-tax ($19.8 million after-tax) as of
January 1, 2005. The minimum pension liabilities totaled
$59.4 million pre-tax ($36.9 million after-tax) and $71.9 million
pre-tax ($44.6 million after-tax) as of January 3, 2004 and
December 28, 2002, respectively.
Earnings per common share–Basic earnings per common share
is computed by dividing: (i) net earnings, after deducting the
after-tax Employee Stock Ownership Plan (“ESOP”) preference
dividends, by (ii) the weighted average number of common
shares outstanding during the year (the “Basic Shares”).
When computing diluted earnings per common share, the
Company assumes that the ESOP preference stock is converted
into common stock and all dilutive stock options are exercised.
After the assumed ESOP preference stock conversion, the ESOP
Trust would hold common stock rather than ESOP preference
stock and would receive common stock dividends ($0.265 per
share in 2004 and $0.230 per share in 2003 and 2002) rather
than ESOP preference stock dividends (currently $3.90 per
share). Since the ESOP Trust uses the dividends it receives