CVS 2004 Annual Report Download - page 21
Download and view the complete annual report
Please find page 21 of the 2004 CVS annual report below. You can navigate through the pages in the report by either clicking on the pages listed below, or by using the keyword search tool below to find specific information within the annual report.-
 1
1 -
2
-
3
-
4
-
5
-
6
-
7
-
8
-
9
-
10
-
 11
11 -
 12
12 -
 13
13 -
 14
14 -
 15
15 -
 16
16 -
 17
17 -
 18
18 -
 19
19 -
 20
20 -
 21
21 -
 22
22 -
 23
23 -
 24
24 -
 25
25 -
 26
26 -
 27
27 -
 28
28 -
 29
29 -
 30
30 -
 31
31 -
32
-
33
-
34
-
35
-
36
-
37
-
38
-
39
-
40
-
41
-
42
-
43
-
44
-
45
-
46
-
47
-
48
-
49
-
50
-
51
-
52
 |
 |

wedo this. Our relocation strategy remains an important
component of our overall growth strategy, as only 55% of
our existing stores were freestanding as of January 1, 2005.
²The comparable increase in total net sales in 2004 was
negatively affected by the 53rd week in 2003, which
generated $530.8 million in net sales.
²Pharmacy sales continued to benefit from new market
expansions, increased penetration in existing markets, our
ability to attract and retain managed care customers and
favorable industry trends. These trends include an aging
American population that is consuming more prescription
drugs, the availability of new prescription drugs, and the
increased use of pharmaceuticals as the first line of defense
for individual healthcare. We believe these favorable industry
trends will continue.
²Pharmacy sales were negatively impacted in all years by the
conversion of brand named drugs to equivalent generic drugs,
which typically have a lower selling price. However, our gross
margins on generic drug sales are generally higher than our
gross margins on equivalent brand named drug sales.
²Front store sales benefited from an increase in promotional
programs in 2002 that were designed to respond to
competitive and economic conditions, and from the
implementation of our Assisted Inventory Management
system, which increased our in-stock positions.
²Our pharmacy growth has been adversely affected by the
growth of the mail order channel, a decline in the number
ofsignificant new drug introductions, higher consumer
co-payments and co-insurance arrangements and an increase
in the number of over-the-counter remedies that had
historically only been available by prescription. To address
this trend, during 2004, we announced we would not
participate in certain prescription benefit programs that
mandate filling maintenance prescriptions through a mail
order service facility. In the event this trend continues and
we elect to, for any reason, withdraw from current programs
and/or decide not to participate in future programs, we may
not be able to sustain our current rate of sales growth.
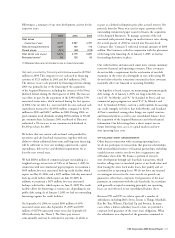
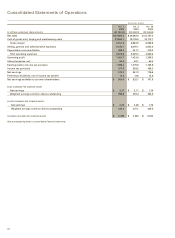
Gross margin, which includes net sales less the cost of
merchandise sold during the reporting period and the related
purchasing costs, warehousing costs, delivery costs and actual
and estimated inventory losses, as a percentage of net sales was
26.3% in 2004. This compares to 25.8% in 2003 and 25.1% in
2002. As you review our gross margin performance, we believe
you should consider the following important information:
²Our pharmacy gross margin rate continued to benefit from
an increase in generic drug sales in 2004, which normally
yield a higher gross margin than brand name drug sales.
²Our gross margin rate continued to benefit from reduced
inventory losses as a result of programs initiated during the
second half of 2002 and subsequent periods. While we
believe these programs will continue to provide operational
benefits, particularly for the Acquired Businesses, we expect
the future financial improvement to be less significant.
In addition, we cannot guarantee that our programs will
continue to reduce inventory losses.
²Our total gross margin rate benefited from an earlier and
more severe flu season in the fourth quarter of 2003, which
increased over-the-counter product sales such as cough
and cold and flu related prescription sales, both of which
generally yield higher gross margins.
²Our gross margin rate continues to be adversely affected by
pharmacy sales growing at a faster pace than front store sales.
On average, our gross margin on pharmacy sales is lower
than our gross margin on front store sales. Pharmacy sales
were 70.0% of total sales in 2004, compared to 68.8% in
2003 and 67.6% in 2002. In addition, sales to customers
covered by third party insurance programs have continued
to increase and, thus, have become a larger component of
our total pharmacy business. On average, our gross margin
on third party pharmacy sales is lower than our gross margin
on non-third party pharmacy sales. Third party pharmacy
sales were 94.1% of pharmacy sales in 2004, compared to
93.2% in 2003 and 92.3% in 2002. We expect these negative
trends to continue.
²Our gross margin rate in 2002 was negatively impacted
by higher markdowns associated with increased promotional
programs that were designed to respond to competitive and
economicconditions.
²Our thirdpartygross margin rates have been adversely
affected by the efforts of managed care organizations,
pharmacy benefitmanagers, governmental and other
thirdpartypayors to reduce their prescription drug costs.
Toaddress this trend, we have dropped and/or renegotiated
anumber of thirdparty programs that fell below our
minimum profitability standards. To date, these efforts have
helped stabilize our third party reimbursement rates. In the
event this trend continues and we elect to, for any reason,
withdraw from current third party programs and/or decide
not to participate in future programs, we may not be able
to sustain our current rate of sales growth and gross margin
dollars could be adversely impacted.
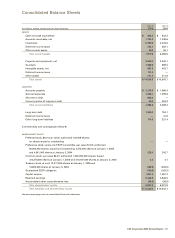
Total operating expenses, which include store and
administrative payroll, employee benefits, store and
administrative occupancy costs, selling expenses, advertising
expenses, administrative expenses and depreciation and
amortization expense were 21.5% of net sales in 2004. During
the fourth quarter of 2004, we conformed our accounting
for operating leases and leasehold improvements to the views
expressed by the Office of the Chief Accountant of the Securities
and Exchange Commission to the American Institute of
Certified Public Accountants on February 7, 2005. As a result,
we recorded a $65.9 million non-cash pre-tax adjustment to
total operating expenses, which represents the cumulative
effect of the adjustment for a period of approximately 20 years
CVS Corporation 2004 Annual Report |19