CVS 2004 Annual Report Download - page 46
Download and view the complete annual report
Please find page 46 of the 2004 CVS annual report below. You can navigate through the pages in the report by either clicking on the pages listed below, or by using the keyword search tool below to find specific information within the annual report.-
 1
1 -
2
-
3
-
4
-
5
-
6
-
7
-
8
-
9
-
10
-
11
-
12
-
13
-
14
-
15
-
16
-
17
-
18
-
19
-
20
-
21
-
22
-
23
-
24
-
25
-
26
-
27
-
28
-
29
-
30
-
31
-
32
-
33
-
34
-
35
-
 36
36 -
 37
37 -
 38
38 -
 39
39 -
 40
40 -
 41
41 -
 42
42 -
 43
43 -
 44
44 -
 45
45 -
 46
46 -
 47
47 -
 48
48 -
 49
49 -
 50
50 -
 51
51 -
 52
52
 |
 |

As of January 1, 2005, the Retail Pharmacy segment included
5,328 retail drugstores and the Company’s online retail website,
CVS.com.
®The retail drugstores are located in 34 states and
the District of Columbia and operate under the CVS®or
CVS/pharmacy®name. The Retail Pharmacy segment is the
Company’s only reportable segment.
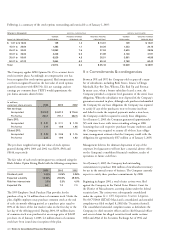
The PBM segment provides a full range of prescription benefit
management services to managed care providers and other
organizations. These services include mail order pharmacy
services, specialty pharmacy services, plan design and
administration, formulary management and claims processing.
The specialty pharmacy business focuses on supporting
individuals that require complex and expensive drug therapies.
The PBM segment operates under the PharmaCare Management
Services and PharmaCare Pharmacy®names and includes
47 retail pharmacies, located in 19 states and the District
of Columbia.
The Company evaluates segment performance based on
operating profit before the effect of non-recurring charges
and gains and certain intersegment activities and charges.
The accounting policies of the segments are substantially the
same as those described in Note 1.
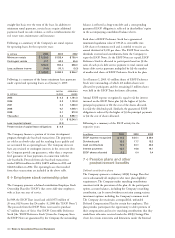
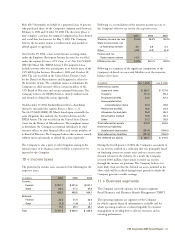
Following is a reconciliation of the significant components of the
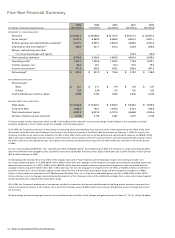
Company’s net sales for the respective years:
2004 2003 2002
Pharmacy 70.0% 68.8% 67.6%
Front store 30.0 31.2 32.4
100.0% 100.0% 100.0%
44 | Notes to Consolidated Financial Statements
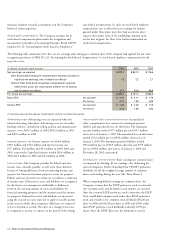
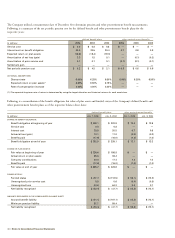
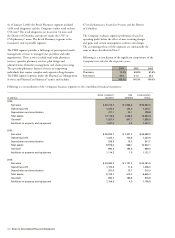
Following is a reconciliation of the Company’s business segments to the consolidated financial statements:
RETAIL PHARMACY PBM CONSOLIDATED
In millions SEGMENT SEGMENT TOTALS
2004:
Net sales $ 28,728.7 $ 1,865.6 $ 30,594.3
Operating profit 1,320.8 133.9 1,454.7
Depreciation and amortization 471.1 25.7 496.8
Total assets 13,118.5 1,428.3 14,546.8
Goodwill 1,257.4 641.1 1,898.5
Additions to property and equipment 1,341.5 6.2 1,347.7
2003:
Net sales $ 25,280.7 $ 1,307.3 $ 26,588.0
Operating profit 1,323.1 100.5 1,423.6
Depreciation and amortization 326.5 15.2 341.7
Total assets 9,975.0 568.1 10,543.1
Goodwill 690.4 198.6 889.0
Additions to property and equipment 1,114.2 7.5 1,121.7
2002:
Net sales $ 23,060.2 $ 1,121.3 $ 24,181.5
Operating profit 1,134.6 71.6 1,206.2
Depreciation and amortization 297.6 12.7 310.3
Total assets 9,132.1 513.2 9,645.3
Goodwill 690.4 188.5 878.9
Additions to property and equipment 1,104.5 4.3 1,108.8