Brother International 2008 Annual Report Download - page 42
Download and view the complete annual report
Please find page 42 of the 2008 Brother International annual report below. You can navigate through the pages in the report by either clicking on the pages listed below, or by using the keyword search tool below to find specific information within the annual report.-
 1
1 -
2
-
3
-
4
-
5
-
6
-
7
-
8
-
9
-
10
-
11
-
12
-
13
-
14
-
15
-
16
-
17
-
18
-
19
-
20
-
21
-
22
-
23
-
24
-
25
-
26
-
27
-
28
-
29
-
30
-
31
-
 32
32 -
 33
33 -
 34
34 -
 35
35 -
 36
36 -
 37
37 -
 38
38 -
 39
39 -
 40
40 -
 41
41 -
 42
42 -
 43
43 -
 44
44 -
 45
45 -
 46
46 -
 47
47 -
 48
48
 |
 |

40 Brother Annual Report 2008
NOTES TO CONSOLIDATED FINANCIAL STATEMENTS
Brother Industries, Ltd. and Consolidated Subsidiaries
For the Years ended March 31, 2008 and 2007
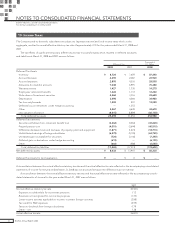
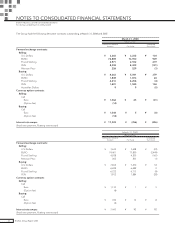
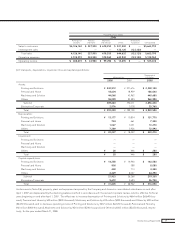
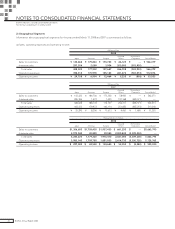
2) Geographical Segments
Information about geographical segments for the years ended March 31, 2008 and 2007 is summarized as follows:
(a) Sales, operating expenses and operating income:
Millions of Yen
2008
Asia and Eliminations
Japan Americas Europe Others /Corporate Consolidated
Sales to customers ¥ 130,668 ¥ 175,843 ¥ 193,743 ¥ 66,125 ¥ —¥ 566,379
Interarea sales 297,354 2,089 3,904 200,583 (503,930) —
Total sales 428,022 177,932 197,647 266,708 (503,930) 566,379
Operating expenses 398,314 170,978 185,183 261,473 (503,072) 512,876
Operating income ¥ 29,708 ¥ 6,954 ¥ 12,464 ¥ 5,235 ¥ (858) ¥ 53,503
Millions of Yen
2007
Asia and Eliminations
Japan Americas Europe Others /Corporate Consolidated
Sales to customers ¥ 143,322 ¥ 186,706 ¥ 173,302 ¥ 58,943 ¥ — ¥ 562,273
Interarea sales 285,306 1,472 1,425 197,368 (485,571) —
Total sales 428,628 188,178 174,727 256,311 (485,571) 562,273
Operating expenses 403,333 179,972 163,114 251,850 (487,251) 511,018
Operating income ¥ 25,295 ¥ 8,206 ¥ 11,613 ¥ 4,461 ¥ 1,680 ¥ 51,255
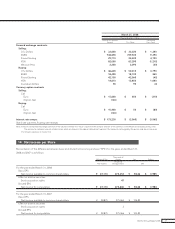
Thousands of U.S. Dollars
2008
Asia and Eliminations
Japan Americas Europe Others /Corporate Consolidated
Sales to customers $1,306,680 $1,758,430 $1,937,430 $ 661,250 $ —$5,663,790
Interarea sales 2,973,540 20,890 39,040 2,005,830 (5,039,300) —
Total sales 4,280,220 1,779,320 1,976,470 2,667,080 (5,039,300) 5,663,790
Operating expenses 3,983,140 1,709,780 1,851,830 2,614,730 (5,030,720) 5,128,760
Operating income $ 297,080 $ 69,540 $ 124,640 $ 52,350 $ (8,580) $ 535,030