Brother International 2008 Annual Report Download - page 3
Download and view the complete annual report
Please find page 3 of the 2008 Brother International annual report below. You can navigate through the pages in the report by either clicking on the pages listed below, or by using the keyword search tool below to find specific information within the annual report.-
 1
1 -
 2
2 -
 3
3 -
 4
4 -
 5
5 -
 6
6 -
 7
7 -
 8
8 -
 9
9 -
 10
10 -
 11
11 -
 12
12 -
 13
13 -
 14
14 -
15
-
16
-
17
-
18
-
19
-
20
-
21
-
22
-
23
-
24
-
25
-
26
-
27
-
28
-
29
-
30
-
31
-
32
-
33
-
34
-
35
-
36
-
37
-
38
-
39
-
40
-
41
-
42
-
43
-
44
-
45
-
46
-
47
-
48
 |
 |
MESSAGE FROM THE MANAGEMENT
1Brother Annual Report 2008
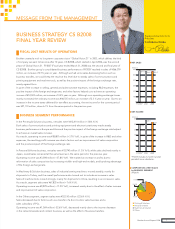
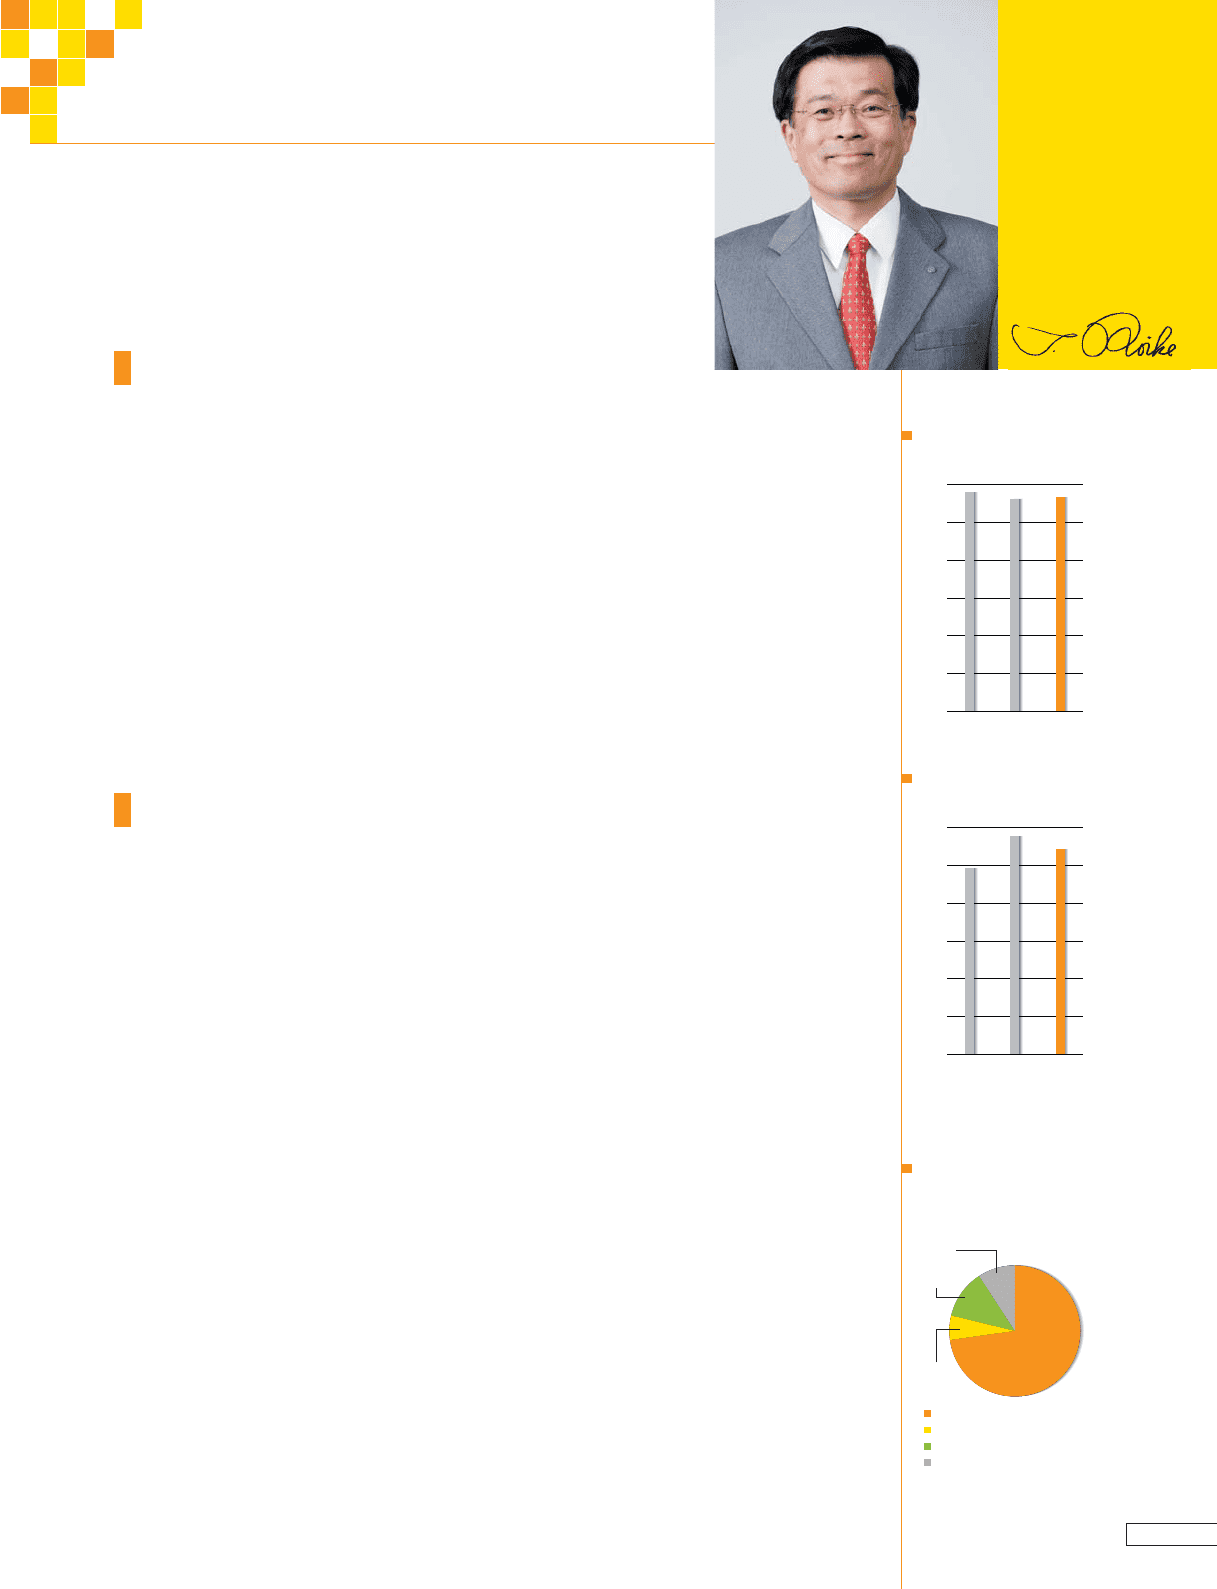
NET INCOME
(¥ billion)
24.6
FY2005*2006 2007
28.9
27.1
0
5
10
15
20
25
30
*FY2005 includes 3-month transition
period of some subsidiaries.
0
100
200
300
400
500
600
NET SALES
(¥ billion)
579.2
FY2005*2006 2007
562.3 566.4
COMPOSITION of NET SALES
by BUSINESS SEGMENT
(FY2007)
72.8%
6.0%
12.0%
9.2%
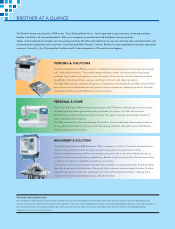
Printing & Solutions
Personal & Home
Machinery & Solution
Others
BUSINESS STRATEGY CS B2008
FINAL YEAR REVIEW
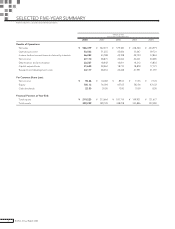
FISCAL 2007 RESULTS OF OPERATIONS
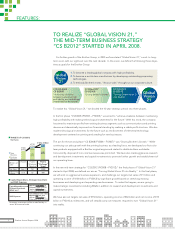
Brother created a mid- to long-term corporate vision “Global Vision 21” in 2003, which defines the kind
of company we want to become after 10 years. CS B2008, which started in April 2006, was the second
phase of Global Vision 21. FY2007 (Fiscal year ended March 31, 2008) was the second and final year of
CS B2008. Brother group’s consolidated business performance of FY2007 resulted in sales of ¥566,379
million, an increase of 0.7% year on year. Although we had some sales-decreasing factors such as
business transfers, we could keep the result at this level due to steady sales of communications and
printing equipment and machine tools, as well as the positive impact of the foreign exchange rate,
mainly against Euro.
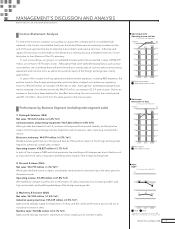
In spite of the increase in selling, general and administrative expenses, including R&D expenses, the
positive impact of the foreign exchange rate, and other factors helped us to achieve an operating
income of ¥53,503 million, an increase of 4.4% year on year. Although non-operating exchange losses
mainly increased, the ordinary income was ¥46,535 million, an increase of 2.3 % year on year. Due to an
increase in the income taxes-deferred for tax effect accounting, the net income for the current period
was ¥27,110 million, down 6.1% from the same period in the previous year.
BUSINESS SEGMENT PERFORMANCE
In the Printing & Solutions business, net sales were ¥412,614 million (+3.8% YoY).
Both sales of communications and printing equipment and electronic stationery made steady
business performance in Europe and Asia and the positive impact of the foreign exchange rate helped
to achieve an overall sales increase.
As a result, operating income was ¥38,807 million (+3.7% YoY), in spite of the increase in R&D and other
expenses, the resulting profit increase was due to factors such as improvement of sales composition
and the positive impact of the foreign exchange rate.
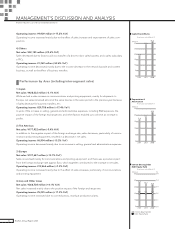
In Personal & Home business, net sales were ¥33,790 million (-1.3% YoY), while sales declined mainly in
Japan, overall sales remained at the same level as in the same period in the previous year.
Operating income was ¥3,398 million (+37.8% YoY). We marked an increase in profits due to
reformation of sales composition by increasing middle- and high-end models, and by taking advantage
of the foreign exchange rate.
In Machinery & Solution business, sales of industrial sewing machines moved steadily, mainly for
shipments to Turkey, and the overall performance also turned out to include an increase in sales.
Sales of machine tools moved strongly, mainly for shipments to China, resulting in an increase in sales.
As a result, segment sales were ¥67,825 million (+7.6% YoY).
Operating income was ¥9,929 million (+17.2% YoY), increased mainly due to the effect of sales increase
and improvement of sales composition.
In the Others segment, segment sales were ¥52,150 million (-22.6% YoY).
Sales decreased due to factors such as a transfer of a door-to-door sales business and a
sales subsidiary of PCs.
Operating income was ¥1,369 million (-52.6% YoY), decreased mainly due to the income decrease
in the network karaoke and content business, as well as the effect of business transfers.
Representative Director &
President
Toshikazu Koike