Brother International 2008 Annual Report Download - page 10
Download and view the complete annual report
Please find page 10 of the 2008 Brother International annual report below. You can navigate through the pages in the report by either clicking on the pages listed below, or by using the keyword search tool below to find specific information within the annual report.-
 1
1 -
 2
2 -
 3
3 -
 4
4 -
 5
5 -
 6
6 -
 7
7 -
 8
8 -
 9
9 -
 10
10 -
 11
11 -
 12
12 -
 13
13 -
 14
14 -
 15
15 -
 16
16 -
 17
17 -
 18
18 -
 19
19 -
 20
20 -
 21
21 -
22
-
23
-
24
-
25
-
26
-
27
-
28
-
29
-
30
-
31
-
32
-
33
-
34
-
35
-
36
-
37
-
38
-
39
-
40
-
41
-
42
-
43
-
44
-
45
-
46
-
47
-
48
 |
 |

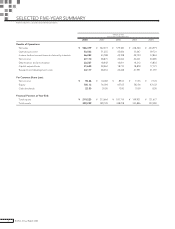
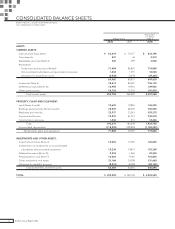
SELECTED FIVE-YEAR SUMMARY
Brother Industries, Ltd. and Consolidated Subsidiaries
Millions of Yen
Fiscal years ended March 31
2008 2007 2006 2005 2004
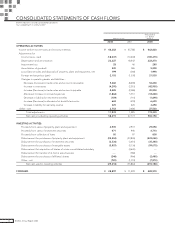
Results of Operations:
Net sales ¥ 566,379 ¥ 562,273 ¥ 579,180 ¥ 438,540 ¥ 424,919
Operating income 53,503 51,255 45,004 33,447 39,721
Income before income taxes and minority interests 46,282 45,788 42,328 29,724 33,863
Net income 27,110 28,875 24,644 20,401 20,485
Depreciation and amortization 22,227 18,442 16,811 14,212 13,803
Capital expenditures 31,605 28,962 18,710 18,878 17,121
Research and development costs 34,117 28,454 25,248 21,991 21,397
Per Common Share (yen):
Net income ¥ 98.46 ¥ 104.82 ¥ 89.03 ¥ 73.55 ¥ 73.76
Equity 785.13 763.94 657.05 542.56 476.32
Cash dividends 22.00 20.00 13.00 10.00 8.50
Financial Position at Year-End:
Total equity ¥ 219,223 ¥ 213,664 ¥ 181,114 ¥ 149,921 ¥ 131,677
Total assets 392,259 399,109 348,218 343,896 323,090
8Brother Annual Report 2008