Brother International 2008 Annual Report Download - page 4
Download and view the complete annual report
Please find page 4 of the 2008 Brother International annual report below. You can navigate through the pages in the report by either clicking on the pages listed below, or by using the keyword search tool below to find specific information within the annual report.-
 1
1 -
 2
2 -
 3
3 -
 4
4 -
 5
5 -
 6
6 -
 7
7 -
 8
8 -
 9
9 -
 10
10 -
 11
11 -
 12
12 -
 13
13 -
 14
14 -
 15
15 -
16
-
17
-
18
-
19
-
20
-
21
-
22
-
23
-
24
-
25
-
26
-
27
-
28
-
29
-
30
-
31
-
32
-
33
-
34
-
35
-
36
-
37
-
38
-
39
-
40
-
41
-
42
-
43
-
44
-
45
-
46
-
47
-
48
 |
 |
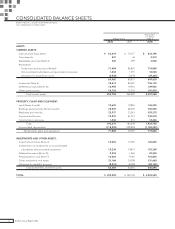
Brother Annual Report 2008
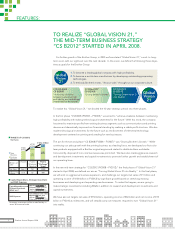
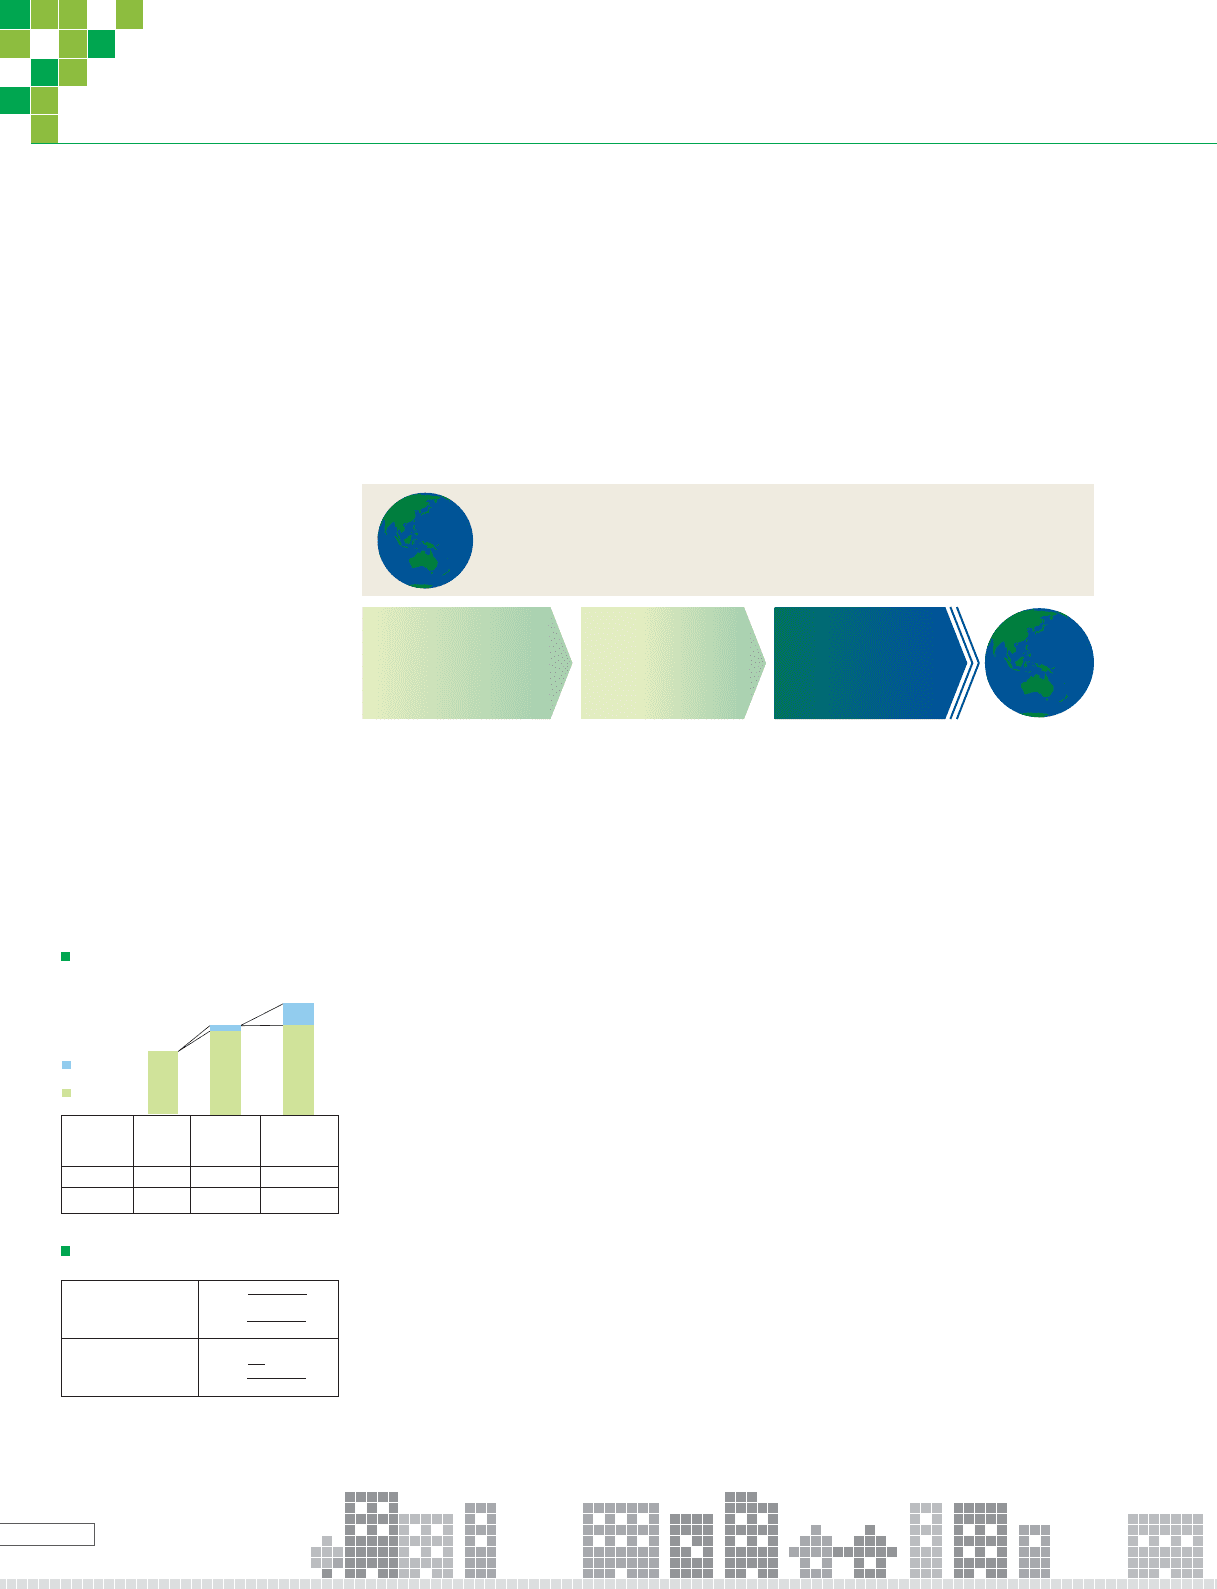
For further growth of the Brother Group, in 2003 we formulated “Global Vision 21,” a mid- to long-
term vision with our sights set over the next decade. In this vision, we define the following three objec-
tives as goals for the Brother Group:
To realize this “Global Vision 21,” we divided the 10-year-strategic period into three phases.
In the first phase “CS B2005 (FY2003 – FY2005),” we aimed to “achieve a balance between maintaining
high profitability with making technological investments for the future.” With this mind, the company
has aimed to maximize profits from existing business segments such as communications and printing
devices and dramatically improved our financial standing by realizing a stable profit structure. We also
made technological investments for the future such as reinforcement of elemental technology
development centered on printing and seeding for new businesses.
The aim for the second phase “CS B2008 (FY2006 – FY2007)” was “Driving Brother’s Growth.” While
continuing our sales growth with the printing business as a leading force, we developed our first color
laser products equipped with a Brother original engine and started to distribute them worldwide.
Concurrently, disposal of non-core businesses was promoted. We have also made aggressive research
and development investments and capital investments to promote further growth and establishment of
our operating base.
In the new mid-term strategy for “CS B2012 (FY2008 – FY2012),” the final phase of “Global Vision 21”
started in April 2008, we defined our aim as “Turning Global Vision 21 into Reality.” In this final phase,
we will work on aggressive business expansion, and challenge our targets (net sales of ¥1 trillion and
operating income of ¥100 billion in FY2012) by significant growth based on stretching existing
businesses and developing and expanding new businesses. To make this happen, we are going to
make strategic investments (including M&A) in addition to research and development investments and
capital investments.
We have also set targets net sales of ¥750 billion, operating income of ¥60 billion and net income of ¥35
billion in FY2010 as milestones, and will steadily carry out measures required to turn “Global Vision 21”
into reality.
TO REALIZE “GLOBAL VISION 21,”
THE MID-TERM BUSINESS STRATEGY
“CS B2012” STARTED IN APRIL 2008.
2
FEATURES:
1. To become a leading global company with high profitability.
2. To become a world-class manufacturer by developing outstanding proprietary
technologies.
3. To embody Brother’s motto, “At your side,” throughout our corporate culture.
Global
Vision
21
FY2003-2005
CS B2005
“Achieving a balance
between sustaining high
profitability and technology
investment for the future”
FY2008-2012
CS B2012
“Turning Global Vision 21
into Reality”
FY2006-2007
CS B2008
“Driving Brother‘s Growth”Global
Vision
21
TARGETS of CS B2012
Net Sales
Capital Expenditure, Strategic Investment
and R&D Expenses
FY2007 FY2010 FY2012
Milestone ”Challenge“
Objective Target
566.4 750 1,000
53.5 60 100
(Billions of
yen)
Capital Expenditure and
Strategic Investment
(M&A, etc.)*
R&D Expenses
Net Sales
Approx. ¥350 billion in
five years (until FY2012)
Consolidated sales ratio:
approx. 6% per year
Approx. ¥200 billion in
three years (until FY2010)
Approx. ¥130 billion in
three years (until FY2010)
¥566
billion
New
Business
¥750
billion
¥50
billion
¥200
billion
¥800
billion
¥700
billion
¥ One-trillion
Operating
Income
Existing
Business
*Strategic investment will be made flexibly in
terms of time and scale.