Brother International 2008 Annual Report Download - page 12
Download and view the complete annual report
Please find page 12 of the 2008 Brother International annual report below. You can navigate through the pages in the report by either clicking on the pages listed below, or by using the keyword search tool below to find specific information within the annual report.-
 1
1 -
 2
2 -
 3
3 -
 4
4 -
 5
5 -
 6
6 -
 7
7 -
 8
8 -
 9
9 -
 10
10 -
 11
11 -
 12
12 -
 13
13 -
 14
14 -
 15
15 -
 16
16 -
 17
17 -
 18
18 -
 19
19 -
 20
20 -
 21
21 -
 22
22 -
23
-
24
-
25
-
26
-
27
-
28
-
29
-
30
-
31
-
32
-
33
-
34
-
35
-
36
-
37
-
38
-
39
-
40
-
41
-
42
-
43
-
44
-
45
-
46
-
47
-
48
 |
 |
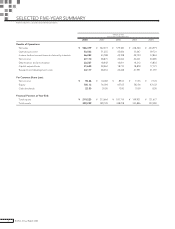
10 Brother Annual Report 2008
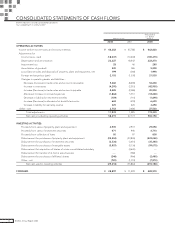
Capital Expenditures
(¥ billion)
2006 2007 2008
Fiscal years ended March 31
0
5
10
15
20
25
30
18.7
29.0
31.6
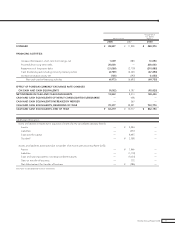
Depreciation &
Amortization
(¥ billion)
2006 2007 2008
Fiscal years ended March 31
0
5
10
15
20
25
16.8
18.4
22.2
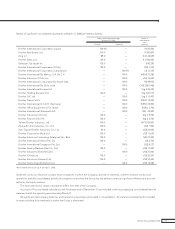
Interest-bearing Debt
Debt Equity Ratio
(¥ billion)
Interest-bearing Debt
(%)
Debt Equity Ratio
2006 2007 2008
37.5 35.3 33.6
Fiscal years ended March 31
0
10
20
30
40
50
0.2 0.2 0.2
0.0
0.1
0.2
0.3
0.4
0.5
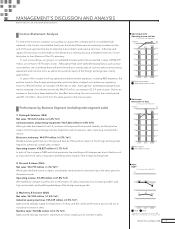
Operating income: ¥9,929 million (+17.2% YoY)
Operating income increased mainly due to the effect of sales increase and improvement of sales com-
position.
4) Others
Net sales: ¥52,150 million (-22.6% YoY)
Sales decreased due to factors such as a transfer of a door-to-door sales business and a sales subsidiary
of PCs.
Operating income: ¥1,369 million (-52.6% YoY)
Operating income decreased, mainly due to the income decrease in the network karaoke and content
business, as well as the effect of business transfers.
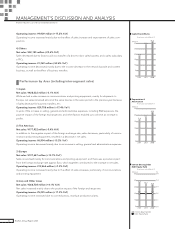
Performance by Area (including inter-segment sales)
1) Japan
Net sales: ¥428,022 million (-0.1% YoY)
While we had a sales increase in communications and printing equipment, mainly for shipments to
Europe, net sales remained almost at the same level as in the same period in the previous year because
of sales decrease for business transfers, etc.
Operating income: ¥29,708 million (+17.4% YoY)
In spite of the increase in selling, general and administrative expenses, including R&D expenses, the
positive impact of the foreign exchange rate, and other factors enabled us to achieve an increase in
profits.
2) The Americas
Net sales: ¥177,932 million (-5.4% YoY)
In addition to the negative impact of the foreign exchange rate, sales decreases, particularly of commu-
nications and printing equipment, resulted in a decrease in net sales.
Operating income: ¥6,954 million (-15.3% YoY)
Operating income decreased mainly due to an increase in selling, general and administrative expenses.
3) Europe
Net sales: ¥197,647 million (+13.1% YoY)
Sales moved well mainly for communications and printing equipment, and there was a positive impact
from the foreign exchange rate against Euro, which together contributed to the increase in net sales.
Operating income: ¥12,464 million (+7.3% YoY)
Operating income increased mainly due to the effect of sales increases, particularly of communications
and printing equipment.
4) Asia and Other Areas
Net sales: ¥266,708 million (+4.1% YoY)
Net sales increased mainly due to the positive impact of the foreign exchange rate.
Operating income: ¥5,235 million (+17.3% YoY)
Operating income increased due to cost reductions, mainly at production plants.
MANAGEMENT’S DISCUSSION AND ANALYSIS
Brother Industries, Ltd. and Consolidated Subsidiaries