Brother International 2007 Annual Report Download - page 43
Download and view the complete annual report
Please find page 43 of the 2007 Brother International annual report below. You can navigate through the pages in the report by either clicking on the pages listed below, or by using the keyword search tool below to find specific information within the annual report.-
 1
1 -
2
-
3
-
4
-
5
-
6
-
7
-
8
-
9
-
10
-
11
-
12
-
13
-
14
-
15
-
16
-
17
-
18
-
19
-
20
-
21
-
22
-
23
-
24
-
25
-
26
-
27
-
28
-
29
-
30
-
31
-
32
-
 33
33 -
 34
34 -
 35
35 -
 36
36 -
 37
37 -
 38
38 -
 39
39 -
 40
40 -
 41
41 -
 42
42 -
 43
43 -
 44
44 -
 45
45 -
 46
46 -
 47
47 -
 48
48
 |
 |

41
Brother Annual Report 2007
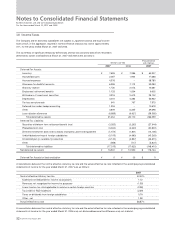
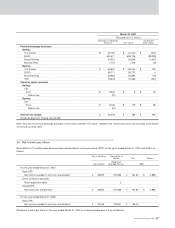
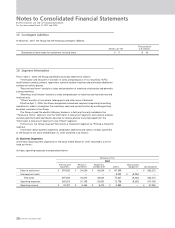
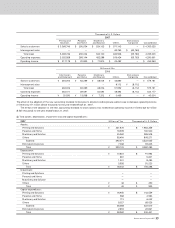
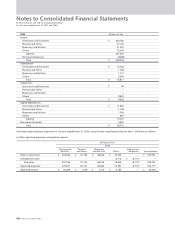
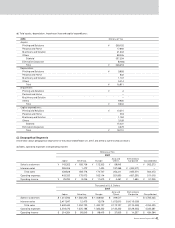
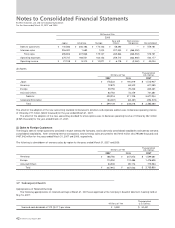
(b) Total assets, depreciation, impairment loss and capital expenditures:
(2) Geographical Segments
Information about geographical segments for the years ended M arch 31, 2007 and 2006 is summarized as follows:
(a) Sales, operating expenses and operating income:
209,152
17,693
41,333
89,026
357,204
(8,986)
348,218
9,858
832
1,107
5,014
16,811
2
-
-
9,930
9,932
10,201
518
1,184
3,128
15,031
3,679
18,710
Assets:
Printing and Solutions
Personal and Home
Machinery and Solution
Others
Subtotal
Elimination/Corporate
Total
Depreciation:
Printing and Solutions
Personal and Home
Machinery and Solution
Others
Total
Impairment:
Printing and Solutions
Personal and Home
Machinery and Solution
Others
Total
Capital expenditures:
Printing and Solutions
Personal and Home
Machinery and Solution
Others
Subtotal
Elimination/Corporate
Total
Millions of Yen
¥
¥
¥
¥
¥
¥
¥
¥
2006
173,302
1,425
174,727
163,114
11,613
Sales to customers
Interarea sales
Total sales
Operating expenses
Operating income
Consolidated
Eliminations
/Corporate
Asia and
OthersEurope
Millions of Yen
2007
¥
¥
186,706
1,472
188,178
179,972
8,206
Am ericas
¥
¥
143,322
285,306
428,628
403,333
25,295
Japan
¥
¥
58,943
197,368
256,311
251,850
4,461
¥
¥
-
(485,571)
(485,571)
(487,251)
1,680
¥
¥
562,273
-
562,273
511,018
51,255
¥
¥
1,468,661
12,076
1,480,737
1,382,322
98,415
Sales to customers
Interarea sales
Total sales
Operating expenses
Operating income
Consolidated
Eliminations
/Corporate
Asia and
OthersEurope
Thousands of U.S. Dollars
2007
$
$
1,582,254
12,475
1,594,729
1,525,186
69,543
Am ericas
$
$
1,214,593
2,417,847
3,632,440
3,418,076
214,364
Japan
$
$
499,517
1,672,610
2,172,127
2,134,322
37,805
$
$
-
(4,115,008)
(4,115,008)
(4,129,245)
14,237
$
$
4,765,025
-
4,765,025
4,330,661
434,364
$
$