Brother International 2007 Annual Report Download - page 11
Download and view the complete annual report
Please find page 11 of the 2007 Brother International annual report below. You can navigate through the pages in the report by either clicking on the pages listed below, or by using the keyword search tool below to find specific information within the annual report.-
 1
1 -
 2
2 -
 3
3 -
 4
4 -
 5
5 -
 6
6 -
 7
7 -
 8
8 -
 9
9 -
 10
10 -
 11
11 -
 12
12 -
 13
13 -
 14
14 -
 15
15 -
 16
16 -
 17
17 -
 18
18 -
 19
19 -
 20
20 -
 21
21 -
 22
22 -
23
-
24
-
25
-
26
-
27
-
28
-
29
-
30
-
31
-
32
-
33
-
34
-
35
-
36
-
37
-
38
-
39
-
40
-
41
-
42
-
43
-
44
-
45
-
46
-
47
-
48
 |
 |
Management's Discussion and Analysis
Brother Industries, Ltd. and Consolidated Subsidiaries
09
Brother Annual Report 2007
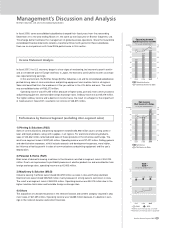
Net Income
Net Income to Sales
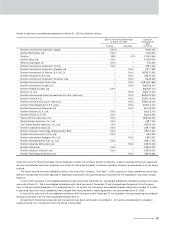
Operating Income
Operating Income to Sales
Operating Income
Operating Income to Sales
Fiscal years ended March 31
(¥ billion) (%)
60
50
40
30
20
10
0
9.0
7.5
6.0
4.5
3.0
1.5
0
2006 20072005
33.4
7.6 7.8
45.0
51.3
9.1
Net Income
Net Income to Sales
Fiscal years ended March 31
(¥ billion) (%)
30
25
20
15
10
5
0
6.0
5.0
4.0
3.0
2.0
1.0
0
2006 20072005
20.4
4.7
4.3
24.6
28.9
5.1
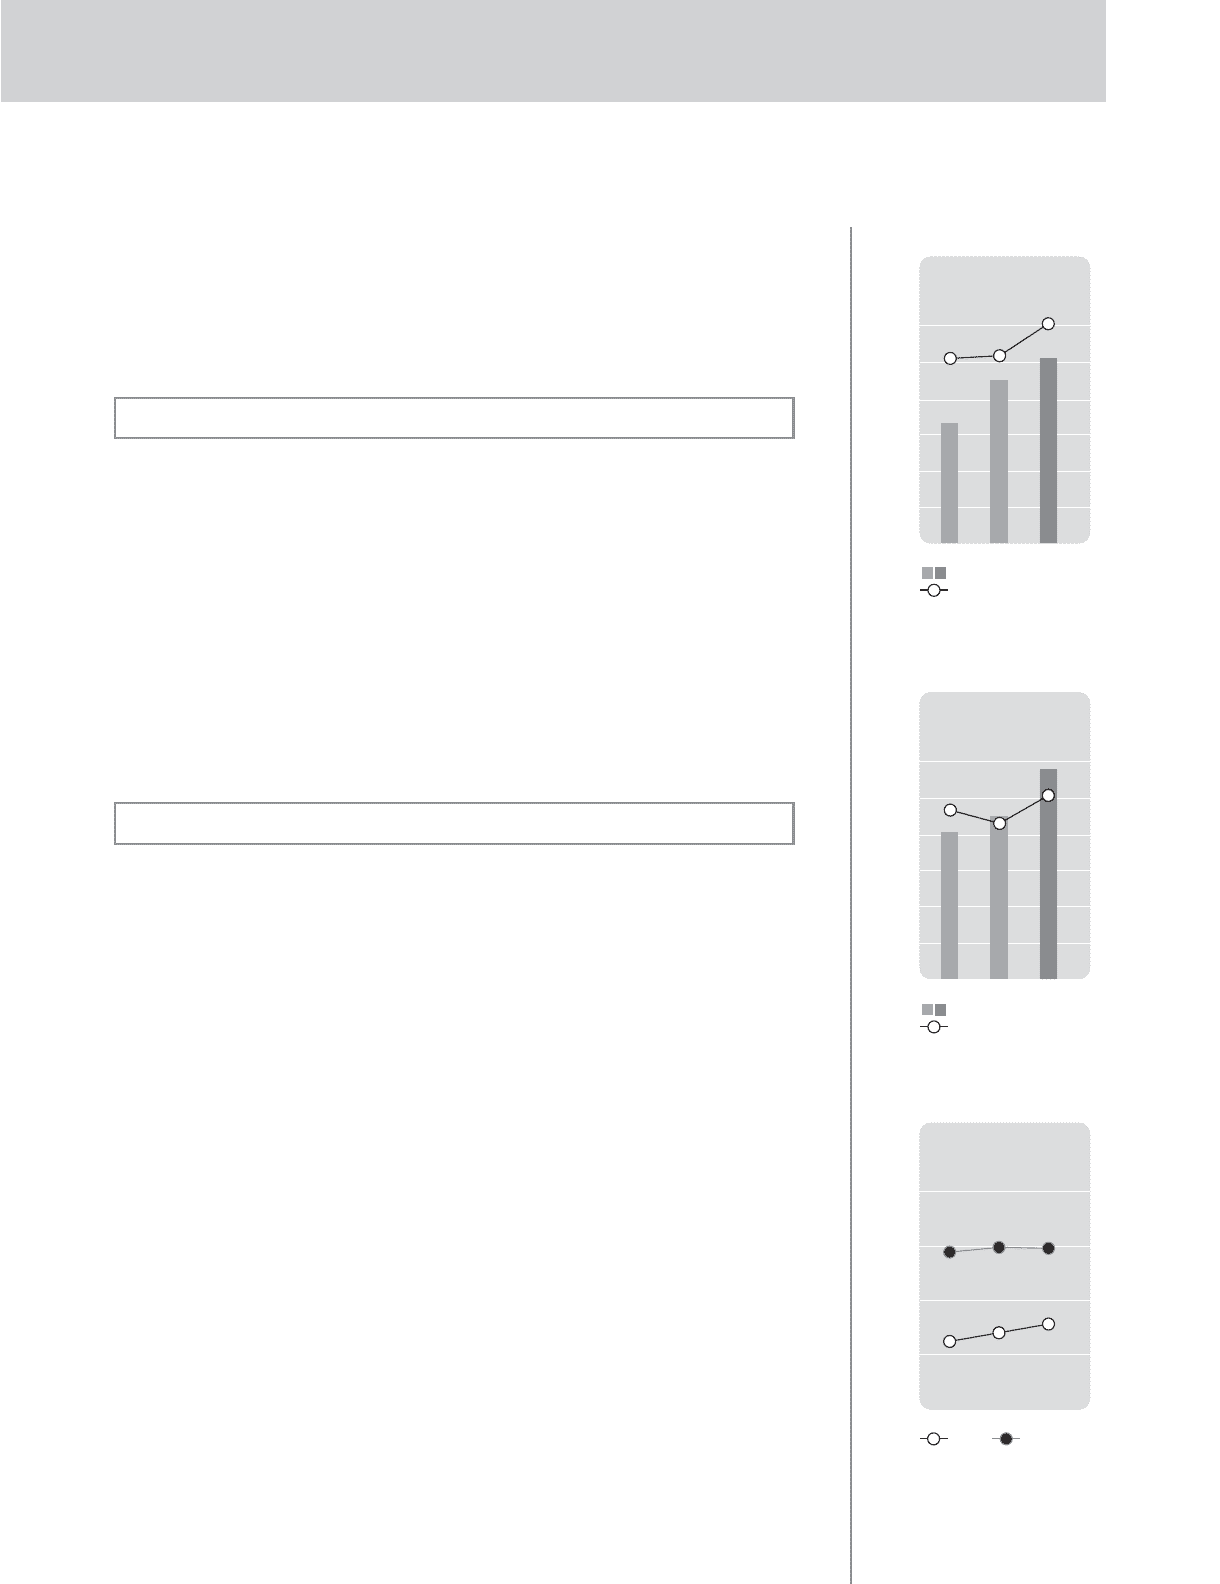
ROA
ROE
Fiscal years ended March 31
(%)
20
15
10
5
02006 20072005
14.9
14.5
*
**
7.1
6.1
ROA ROE
*ROA=Net Income/Average total assetsX100
**ROE=Net Income/Average owner's equity X100
7.7
14.8
In fiscal 2006, some consolidated subsidiaries changed their fiscal years from the year ending
December 31 to the year ending March 31, the same as the fiscal year of Brother Industries, Ltd.
This change better facilitates the management of global business operations. Since the fiscal 2006
consolidated financial statements include a transitional three-month period for these subsidiaries,
there are no comparisons w ith fiscal 2006 performance in this section.
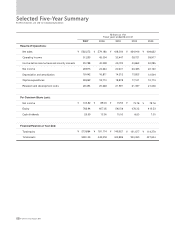
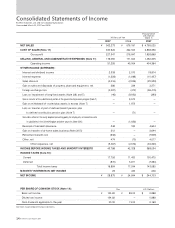
Income Statement Analysis
In fiscal 2007, the U.S. economy began to show signs of w eakening, but economic grow th contin-
ued at a moderate pace in Europe and Asia. In Japan, the economy continued to recover as compa-
nies reported strong earnings.
In this environment, the Brother Group (Brother Industries, Ltd. and its consolidated subsidiaries)
posted strong sales of communications and printing equipment and machine tools in all regions.
Sales also benefited from the w eakness of the yen relative to the U.S. dollar and euro. The result
was consolidated sales of ¥562,273 million.
Operating income w as ¥51,255 million because of higher sales, primarily from communications
and printing equipment, and favorable foreign exchange rates. Ordinary income w as ¥45,479 million.
The higher ordinary income and a decline in income taxes, the result of a charge for the impairment
of fixed assets in fiscal 2007, resulted in net income of ¥28,875 million.
Performance by Business Segment (excluding inter-segment sales)
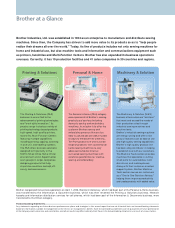
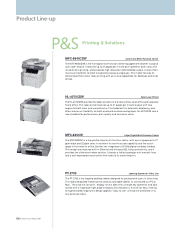
1) Printing & Solutions (P&S)
Sales of communications and printing equipment totaled ¥353,968 million due to strong sales of
laser and inkjet products, along with supplies, in all regions. For electronic stationery products,
sales of ¥43,662 million reflected solid sales of these products in the Americas and Europe. The
result w as segment sales of ¥397,630 million. Operating income was ¥37,427 million. Selling, general
and administrative expenses, w hich include research and development expenses, were higher,
but this w as offset by grow th in sales of communications and printing equipment and the yen's
depreciation.
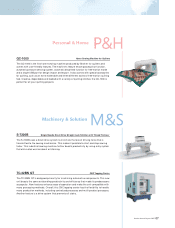
2) Personal & Home (P&H)
Brisk sales of domestic sewing machines in the Americas resulted in segment sales of ¥34,224
million. Due to an improvement in profitability because of a better product mix and a contribution from
foreign exchange rates, operating income w as ¥2,465 million.
3) Machinery & Solution (M&S)
Industrial sewing machines sales totaled ¥34,459 million as sales in Asia and Turkey declined.
Machine tools sales totaled ¥28,565 million mainly because of strong sales to customers in Asia.
The result w as segment sales of ¥63,024 million. Operating income w as ¥8,474 million due to the
higher machine tools sales and favorable foreign exchange rates.
4) Others
The acquisition of a karaoke business in the netw ork karaoke and content category resulted in seg-
ment sales of ¥67,395 million. Operating income was ¥2,889 million because of a decline in earn-
ings in the netw ork karaoke and content business.