Brother International 2007 Annual Report Download - page 31
Download and view the complete annual report
Please find page 31 of the 2007 Brother International annual report below. You can navigate through the pages in the report by either clicking on the pages listed below, or by using the keyword search tool below to find specific information within the annual report.-
 1
1 -
2
-
3
-
4
-
5
-
6
-
7
-
8
-
9
-
10
-
11
-
12
-
13
-
14
-
15
-
16
-
17
-
18
-
19
-
20
-
 21
21 -
 22
22 -
 23
23 -
 24
24 -
 25
25 -
 26
26 -
 27
27 -
 28
28 -
 29
29 -
 30
30 -
 31
31 -
 32
32 -
 33
33 -
 34
34 -
 35
35 -
 36
36 -
 37
37 -
 38
38 -
 39
39 -
 40
40 -
 41
41 -
42
-
43
-
44
-
45
-
46
-
47
-
48
 |
 |

29
Brother Annual Report 2007
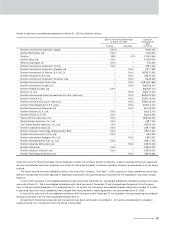
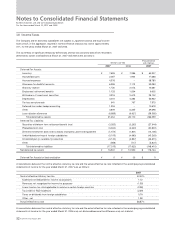
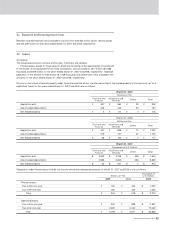
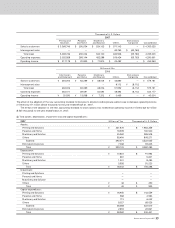
The liability for employees' retirement benefits at M arch 31, 2007 and 2006 consisted of the follow ing:
The components of net periodic benefit costs w ere as follows:
* Includes special termination benefits of ¥725 million ($ 6,144 thousand) paid by a certain consolidated subsidiary.
Assumptions used for the years ended M arch 31, 2007 and 2006 w ere as follow s:
(515,831)
497,051
47,153
(3,949)
24,424
77,805
(53,381)
(57,999)
56,833
4,419
(546)
2,707
7,877
(5,170)
(60,868)
58,652
5,564
(466)
2,882
9,181
(6,299)
Projected benefit obligation
Fair value of plan assets
Unrecognized actuarial loss
Unrecognized prior service benefit
Net liability
Prepaid pension cost
Liability for employees' retirement benefits
Thousands of
U.S. Dollars
200720062007
Millions of Yen
¥
¥
¥
¥
$
$
Straight-line method
Principally from 1.5% to 2.0%
Principally 3.0%
Principally from 7 years to 14 years
Principally from 7 years to 14 years
Straight-line m ethod
Principally from 1.5% to 2.0%
Principally 3.0%
Principally from 7 years to 14 years
Principally from 7 years to 14 years
Periodic recognition of projected benefit obligation
Discount rate
Expected rate of return on plan assets
Recognition period of actuarial gain / loss
Amortization period of prior service benefit / cost
20062007
21,924
12,093
(15,949)
6,576
(508)
7,627
(51)
-
1,805
8,347
41,864
-
-
-
41,864
2,727
1,595
(1,830)
1,417
(203)
162
(8)
1,637
-
943
6,440
(9,572)
71
(1,973)
(5,034)
2,587
1,427
(1,882)
776
(60)
900
(6)
-
213
985
4,940
-
-
-
4,940
Service cost
Interest cost
Expected return on plan assets
Recognized actuarial loss
Amortization of prior service cost*
Additional retirement payments and others
Amounts contributed from employees
Cumulative effect of the new ly adopted accounting policy for employee's
retirement benefits in subsidiaries in the United Kingdom and other countries
Cumulative effect of adoption of actuarial calculation from the impieties
method
Contribution to defined contribution pension plans
Retirement benefits cost
Gain on the transfer of the substitutional portion of governmental pension
program
Loss on transfer of part of defined benefit pension plan to defined
contribution pension plan
Gain on w ithdraw al of trusted plan assets in excess
Thousands of
U.S. Dollars
200720062007
Millions of Yen
¥
¥
¥
¥
¥
¥
$
$
$