Airtran 2008 Annual Report Download - page 53
Download and view the complete annual report
Please find page 53 of the 2008 Airtran annual report below. You can navigate through the pages in the report by either clicking on the pages listed below, or by using the keyword search tool below to find specific information within the annual report.-
 1
1 -
2
-
3
-
4
-
5
-
6
-
7
-
8
-
9
-
10
-
11
-
12
-
13
-
14
-
15
-
16
-
17
-
18
-
19
-
20
-
21
-
22
-
23
-
24
-
25
-
26
-
27
-
28
-
29
-
30
-
31
-
32
-
33
-
34
-
35
-
36
-
37
-
38
-
39
-
40
-
41
-
42
-
 43
43 -
 44
44 -
 45
45 -
 46
46 -
 47
47 -
 48
48 -
 49
49 -
 50
50 -
 51
51 -
 52
52 -
 53
53 -
 54
54 -
 55
55 -
 56
56 -
 57
57 -
 58
58 -
 59
59 -
 60
60 -
 61
61 -
 62
62 -
 63
63 -
64
-
65
-
66
-
67
-
68
-
69
-
70
-
71
-
72
-
73
-
74
-
75
-
76
-
77
-
78
-
79
-
80
-
81
-
82
-
83
-
84
-
85
-
86
-
87
-
88
-
89
-
90
-
91
-
92
-
93
-
94
-
95
-
96
-
97
-
98
-
99
-
100
-
101
-
102
-
103
-
104
-
105
-
106
-
107
-
108
-
109
-
110
-
111
-
112
-
113
-
114
-
115
-
116
-
117
-
118
-
119
-
120
-
121
-
122
-
123
-
124
 |
 |

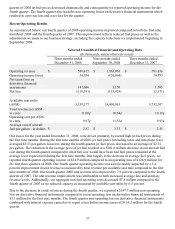
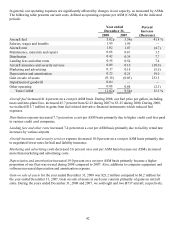
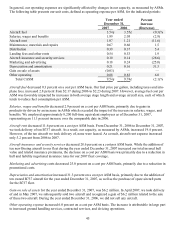
In general, our operating expenses are significantly affected by changes in our capacity, as measured by ASMs.
The following table presents our unit costs, defined as operating expense per ASM, for the indicated periods:
Year ended
December 31,
2007 2006
Percent
Increase
(Decrease)
Aircraft fuel 3.54¢ 3.55¢ (0.3)%
Salaries, wages and benefits 1.99 2.05 (2.9)
Aircraft rent 1.07 1.21 (11.6)
Maintenance, materials and repairs 0.67 0.66 1.5
Distribution 0.39 0.37 5.4
Landing fees and other rents 0.54 0.53 1.9
Aircraft insurance and security services 0.10 0.14 (28.6)
Marketing and advertising 0.18 0.24 (25.0)
Depreciation and amortization 0.21 0.16 31.3
Gain on sale of assets (0.03)
—
—
Other operating 0.88 0.83 6.0
Total CASM 9.54¢ 9.74¢ (2.1)%
Aircraft fuel decreased 0.3 percent on a cost per ASM basis. Our fuel price per gallon, including taxes and into-
plane fees, increased 2.8 percent from $2.17 during 2006 to $2.23 during 2007. However, average fuel cost per
ASM was favorably impacted by increases in both average stage length and average aircraft size, each of which
tends to reduce fuel consumption per ASM.
Salaries, wages and benefits decreased 2.9 percent on a cost per ASM basis, primarily due to gains in
productivity driven by an increase in ASMs which exceeded the impact of the increase in salaries, wages, and
benefits. We employed approximately 8,200 full-time equivalent employees as of December 31, 2007,
representing an 11.1 percent increase over the comparable date in 2006.
Aircraft rent decreased 11.6 percent on a cost per ASM basis. From December 31, 2006 to December 31, 2007,
we took delivery of ten B737 aircraft. As a result, our capacity, as measured by ASMs, increased 19.4 percent.
However, of the ten aircraft we took delivery of, none were leased. As a result, aircraft rent expense increased
only 5.2 percent from 2006 to 2007.
Aircraft insurance and security services decreased 28.6 percent on a cost per ASM basis. While the addition of
ten new Boeing aircraft to our fleet during the year ended December 31, 2007 increased our total insured hull
value and related insurance premiums, the decrease on a cost per ASM basis was primarily due to a reduction in
hull and liability negotiated insurance rates for our 2007 fleet coverage.
Marketing and advertising costs decreased 25.0 percent on a cost per ASM basis, primarily due to a reduction in
promotional costs.
Depreciation and amortization increased 31.3 percent on a cost per ASM basis, primarily due to the addition of
ten owned B737 aircraft for the year ended December 31, 2007, as well as the purchase of spare aircraft parts
for the B737 fleet.
Gain on sale of assets for the year ended December 31, 2007, was $6.2 million. In April 2007, we took delivery
of and in May 2007, we subsequently sold two aircraft and recognized a gain of $6.2 million related to the sale
of these two aircraft. During the year ended December 31, 2006, we did not sell any aircraft.
Other operating expense increased 6.0 percent on a cost per ASM basis. The increase is attributable in large part
to increased ground handling services, contracted services, and de-icing operations.
45