Airtran 2008 Annual Report Download - page 50
Download and view the complete annual report
Please find page 50 of the 2008 Airtran annual report below. You can navigate through the pages in the report by either clicking on the pages listed below, or by using the keyword search tool below to find specific information within the annual report.-
 1
1 -
2
-
3
-
4
-
5
-
6
-
7
-
8
-
9
-
10
-
11
-
12
-
13
-
14
-
15
-
16
-
17
-
18
-
19
-
20
-
21
-
22
-
23
-
24
-
25
-
26
-
27
-
28
-
29
-
30
-
31
-
32
-
33
-
34
-
35
-
36
-
37
-
38
-
39
-
 40
40 -
 41
41 -
 42
42 -
 43
43 -
 44
44 -
 45
45 -
 46
46 -
 47
47 -
 48
48 -
 49
49 -
 50
50 -
 51
51 -
 52
52 -
 53
53 -
 54
54 -
 55
55 -
 56
56 -
 57
57 -
 58
58 -
 59
59 -
 60
60 -
61
-
62
-
63
-
64
-
65
-
66
-
67
-
68
-
69
-
70
-
71
-
72
-
73
-
74
-
75
-
76
-
77
-
78
-
79
-
80
-
81
-
82
-
83
-
84
-
85
-
86
-
87
-
88
-
89
-
90
-
91
-
92
-
93
-
94
-
95
-
96
-
97
-
98
-
99
-
100
-
101
-
102
-
103
-
104
-
105
-
106
-
107
-
108
-
109
-
110
-
111
-
112
-
113
-
114
-
115
-
116
-
117
-
118
-
119
-
120
-
121
-
122
-
123
-
124
 |
 |
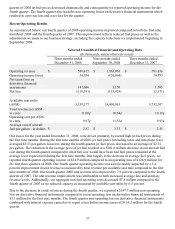
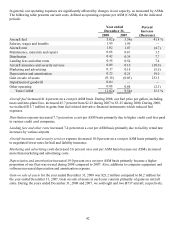
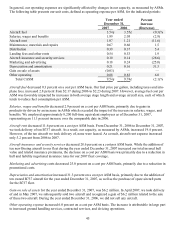
In general, our operating expenses are significantly affected by changes in our capacity, as measured by ASMs.
The following table presents our unit costs, defined as operating expense per ASM (CASM), for the indicated
periods:
Year ended
December 31,
2008 2007
Percent
Increase
(Decrease)
Aircraft fuel 5.02¢ 3.54¢ 41.8 %
Salaries, wages and benefits 1.99 1.99
—
Aircraft rent 1.02 1.07 (4.7)
Maintenance, materials and repairs 0.68 0.67 1.5
Distribution 0.42 0.39 7.7
Landing fees and other rents 0.58 0.54 7.4
Aircraft insurance and security services 0.09 0.10 (10.0)
Marketing and advertising 0.17 0.18 (5.6)
Depreciation and amortization 0.25 0.21 19.0
Gain on sale of assets (0.10) (0.03) 233.3
Impairment of goodwill 0.04
—
—
Other operating 0.86 0.88 (2.3)
Total CASM 11.02¢ 9.54¢ 15.5 %
Aircraft fuel increased 41.8 percent on a cost per ASM basis. During 2008, our fuel price per gallon, including
taxes and into-plane fees, increased 45.7 percent from $2.23 during 2007 to $3.25 during 2008. During 2008,
we realized $15.7 million in gains from fuel related derivative financial instruments which reduced fuel
expenses.
Distribution expense increased 7.7 percent on a cost per ASM basis primarily due to higher credit card fees paid
to various credit card companies.
Landing fees and other rents increased 7.4 percent on a cost per ASM basis primarily due to facility rental rate
increases by various airports.
Aircraft insurance and security services expense decreased 10.0 percent on a cost per ASM basis primarily due
to negotiated lower rates for hull and liability insurance.
Marketing and advertising costs decreased 5.6 percent on a cost per ASM basis because our ASMs increased
more than marketing and advertising costs.
Depreciation and amortization increased 19.0 percent on a cost per ASM basis primarily because a higher
proportion of our fleet was owned during 2008 compared to 2007. Also, additions to computer equipment and
software increased depreciation and amortization expense.
Gain on sale of assets for the year ended December 31, 2008 was $23.2 million compared to $6.2 million for
the year ended December 31, 2007. Gain on sale of assets in each year consists primarily of gains on aircraft
sales. During the years ended December 31, 2008 and 2007, we sold eight and two B737 aircraft, respectively.
42