Airtran 2008 Annual Report Download - page 43
Download and view the complete annual report
Please find page 43 of the 2008 Airtran annual report below. You can navigate through the pages in the report by either clicking on the pages listed below, or by using the keyword search tool below to find specific information within the annual report.-
 1
1 -
2
-
3
-
4
-
5
-
6
-
7
-
8
-
9
-
10
-
11
-
12
-
13
-
14
-
15
-
16
-
17
-
18
-
19
-
20
-
21
-
22
-
23
-
24
-
25
-
26
-
27
-
28
-
29
-
30
-
31
-
32
-
 33
33 -
 34
34 -
 35
35 -
 36
36 -
 37
37 -
 38
38 -
 39
39 -
 40
40 -
 41
41 -
 42
42 -
 43
43 -
 44
44 -
 45
45 -
 46
46 -
 47
47 -
 48
48 -
 49
49 -
 50
50 -
 51
51 -
 52
52 -
 53
53 -
54
-
55
-
56
-
57
-
58
-
59
-
60
-
61
-
62
-
63
-
64
-
65
-
66
-
67
-
68
-
69
-
70
-
71
-
72
-
73
-
74
-
75
-
76
-
77
-
78
-
79
-
80
-
81
-
82
-
83
-
84
-
85
-
86
-
87
-
88
-
89
-
90
-
91
-
92
-
93
-
94
-
95
-
96
-
97
-
98
-
99
-
100
-
101
-
102
-
103
-
104
-
105
-
106
-
107
-
108
-
109
-
110
-
111
-
112
-
113
-
114
-
115
-
116
-
117
-
118
-
119
-
120
-
121
-
122
-
123
-
124
 |
 |
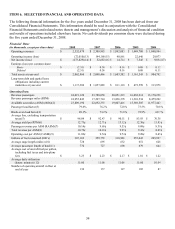
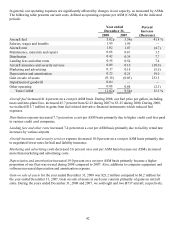
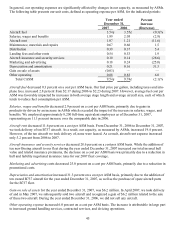
Note: All monetary amounts listed below are pre-tax.
(1) The number of scheduled revenue miles flown by passengers
(2) The number of seats available for passengers multiplied by the number of miles the seats are flown
(3) The percentage of aircraft seating capacity that is actually utilized (RPMs divided by ASMs)
(4) The percentage of seats that must be occupied by revenue passengers in order for us to break even on a pre-
tax income basis
(5) Passenger revenue divided by total passengers
(6) The average amount one passenger pays to fly one mile
(7) Passenger revenue divided by ASMs
(8) Total revenue divided by ASMs
(9) Operating expenses divided by ASMs
(10) Total aircraft miles flown divided by departures
(11) RPMs divided by revenue passengers
(12) The average amount of time per day that an aircraft flown is operated in revenue service
(13) Includes an operating expense reduction of $23.2 million related to the gain on sale of assets, principally
gains on the sale of aircraft, and an operating expense of $8.4 million related to an impairment of goodwill.
(14) Includes an operating expense reduction of $23.2 million related to the gain on sale of assets, principally
gains on the sale of aircraft, an operating expense of $8.4 million related to an impairment of goodwill, and
a non-operating expense of $150.8 million related to losses on fuel derivative instruments.
(15) Includes an operating expense reduction of $6.2 million related to the gain on the sale of two B737 aircraft.
(16) Includes an operating expense reduction of $6.2 million related to the gain on the sale of two B737 aircraft
and non-operating expense of $10.7 million related to costs associated with the proposed acquisition of
Midwest Air Group, Inc. (Midwest), including exchange offer expenses.
(17) Includes a $1.3 million benefit related to our unsuccessful bid for certain leased gates and other assets of
another airline at Chicago-Midway airport and $1.5 million of additional fuel expense related to prior
periods
35