Advance Auto Parts 2011 Annual Report Download - page 76
Download and view the complete annual report
Please find page 76 of the 2011 Advance Auto Parts annual report below. You can navigate through the pages in the report by either clicking on the pages listed below, or by using the keyword search tool below to find specific information within the annual report.-
 1
1 -
2
-
3
-
4
-
5
-
6
-
7
-
8
-
9
-
10
-
11
-
12
-
13
-
14
-
15
-
16
-
17
-
18
-
19
-
20
-
21
-
22
-
23
-
24
-
25
-
26
-
27
-
28
-
29
-
30
-
31
-
32
-
33
-
34
-
35
-
36
-
37
-
38
-
39
-
40
-
41
-
42
-
43
-
44
-
45
-
46
-
47
-
48
-
49
-
50
-
51
-
52
-
53
-
54
-
55
-
56
-
57
-
58
-
59
-
60
-
61
-
62
-
63
-
64
-
65
-
 66
66 -
 67
67 -
 68
68 -
 69
69 -
 70
70 -
 71
71 -
 72
72 -
 73
73 -
 74
74 -
 75
75 -
 76
76 -
 77
77 -
 78
78 -
 79
79 -
 80
80 -
 81
81 -
 82
82 -
 83
83 -
 84
84 -
 85
85 -
 86
86 -
87
-
88
-
89
-
90
-
91
-
92
-
93
-
94
-
95
-
96
-
97
-
98
-
99
-
100
-
101
-
102
-
103
-
104
-
105
-
106
-
107
-
108
-
109
-
110
-
111
-
112
 |
 |

ADVANCE AUTO PARTS, INC. AND SUBSIDIARIES
NOTES TO THE CONSOLIDATED FINANCIAL STATEMENTS
January 1, 2011, January 2, 2010 and January 3, 2009
(in thousands, except per share data)
.
F-22
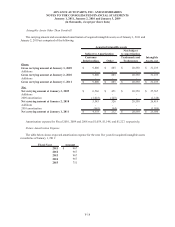
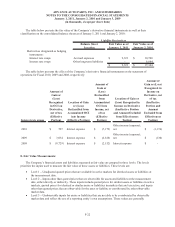
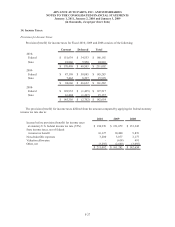
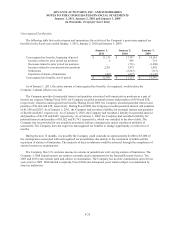
The table below presents the fair value of the Company’s derivative financial instruments as well as their
classification on the consolidated balance sheets as of January 1, 2011 and January 2, 2010:
Balance Sheet Fair Value as of Fair Value as of
Location January 1, 2011 January 2, 2010
Derivatives designated as hedging
instruments:
Interest rate swaps Accrued expenses 9,321$ 10,700$
Interest rate swaps Other long-term liabilities - 6,644
9,321$ 17,344$
Liability Derivatives
The table below presents the effect of the Company’s derivative financial instruments on the statement of
operations for Fiscal 2010, 2009 and 2008, respectively:
Interest rate swaps
Amount of
Gain or
(Loss)
Recognized
in OCI on
Derivative,
net of tax
(Effective
Portion)
Location of Gain
or (Loss)
Reclassified from
Accumulated OCI
into Income
(Effective Portion)
Amount of
Gain or
(Loss)
Reclassified
from
Accumulated
OCI into
Income, net
of tax
(Effective
Portion)
Location of Gain or
(Loss) Recognized in
Income on Derivative
(Ineffective Portion
and Amount Excluded
from Effectiveness
Testing)
A
moun
t
o
f
Gain or (Loss)
Recognized in
Income on
Derivative, net
of tax
(Ineffective
Portion and
Amount
Excluded from
Effectiveness
Testing)
2010 597$ Interest expense (7,179)$
Other income (expense),
net (1,174)$
2009 3,034$ Interest expense (6,618)$
Other income (expense),
net (130)$
2008 (8,729)$ Interest expense (2,152)$ Interest expense -$
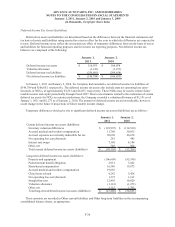
8. Fair Value Measurements:
The Company’s financial assets and liabilities measured at fair value are grouped in three levels. The levels
prioritize the inputs used to measure the fair value of these assets or liabilities. These levels are:
• Level 1 – Unadjusted quoted prices that are available in active markets for identical assets or liabilities at
the measurement date.
• Level 2 – Inputs other than quoted prices that are observable for assets and liabilities at the measurement
date, either directly or indirectly. These inputs include quoted prices for similar assets or liabilities in active
markets, quoted prices for identical or similar assets or liabilities in markets that are less active, and inputs
other than quoted prices that are observable for the asset or liability or corroborated by other observable
market data.
• Level 3 – Unobservable inputs for assets or liabilities that are not able to be corroborated by observable
market data and reflect the use of a reporting entity’s own assumptions. These values are generally