Advance Auto Parts 2011 Annual Report Download - page 59
Download and view the complete annual report
Please find page 59 of the 2011 Advance Auto Parts annual report below. You can navigate through the pages in the report by either clicking on the pages listed below, or by using the keyword search tool below to find specific information within the annual report.-
 1
1 -
2
-
3
-
4
-
5
-
6
-
7
-
8
-
9
-
10
-
11
-
12
-
13
-
14
-
15
-
16
-
17
-
18
-
19
-
20
-
21
-
22
-
23
-
24
-
25
-
26
-
27
-
28
-
29
-
30
-
31
-
32
-
33
-
34
-
35
-
36
-
37
-
38
-
39
-
40
-
41
-
42
-
43
-
44
-
45
-
46
-
47
-
48
-
 49
49 -
 50
50 -
 51
51 -
 52
52 -
 53
53 -
 54
54 -
 55
55 -
 56
56 -
 57
57 -
 58
58 -
 59
59 -
 60
60 -
 61
61 -
 62
62 -
 63
63 -
 64
64 -
 65
65 -
 66
66 -
 67
67 -
 68
68 -
 69
69 -
70
-
71
-
72
-
73
-
74
-
75
-
76
-
77
-
78
-
79
-
80
-
81
-
82
-
83
-
84
-
85
-
86
-
87
-
88
-
89
-
90
-
91
-
92
-
93
-
94
-
95
-
96
-
97
-
98
-
99
-
100
-
101
-
102
-
103
-
104
-
105
-
106
-
107
-
108
-
109
-
110
-
111
-
112
 |
 |
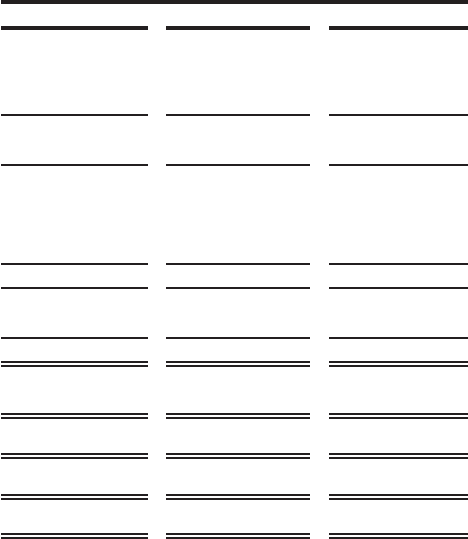
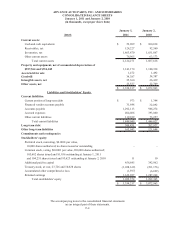
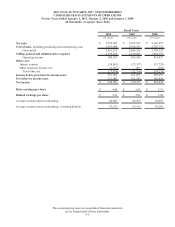
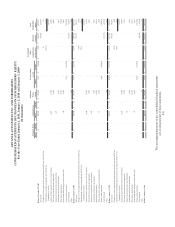
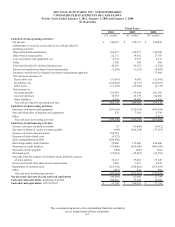
ADVANCE AUTO PARTS, INC. AND SUBSIDIARIES
CONSOLIDATED STATEMENTS OF OPERATIONS
For the Years Ended January 1, 2011, January 2, 2010 and January 3, 2009
(in thousands, except per share data)
The accompanying notes to consolidated financial statements
are an integral part of these statements.
F-5
2010 2009 2008
(52 weeks) (52 weeks) (53 weeks)
Net sales 5,925,203$ 5,412,623$ 5,142,255$
Cost of sales, includin
g
p
urchasin
g
and warehousin
g
costs 2,963,888 2,768,397 2,743,131
Gross profit 2,961,315 2,644,226 2,399,124
2,376,382 2,189,841 1,984,197
Operating income 584,933 454,385 414,927
Other, net:
Interest expense (26,861) (23,337) (33,729)
Other (expense) income, net (1,017) 607 (506)
Total other, net (27,878) (22,730) (34,235)
Income before provision for income taxes 557,055 431,655 380,692
Provision for income taxes 211,002 161,282 142,654
Net income 346,053$ 270,373$ 238,038$
Basic earnings per share 4.00$ 2.85$ 2.51$
Diluted earnings per share 3.95$ 2.83$ 2.49$
Average common shares outstanding 86,082 94,459 94,655
Average common shares outstanding - assuming dilution 87,155 95,113 95,205
Fiscal Years
Selling, general and administrative expenses