Advance Auto Parts 2011 Annual Report Download - page 44
Download and view the complete annual report
Please find page 44 of the 2011 Advance Auto Parts annual report below. You can navigate through the pages in the report by either clicking on the pages listed below, or by using the keyword search tool below to find specific information within the annual report.-
 1
1 -
2
-
3
-
4
-
5
-
6
-
7
-
8
-
9
-
10
-
11
-
12
-
13
-
14
-
15
-
16
-
17
-
18
-
19
-
20
-
21
-
22
-
23
-
24
-
25
-
26
-
27
-
28
-
29
-
30
-
31
-
32
-
33
-
 34
34 -
 35
35 -
 36
36 -
 37
37 -
 38
38 -
 39
39 -
 40
40 -
 41
41 -
 42
42 -
 43
43 -
 44
44 -
 45
45 -
 46
46 -
 47
47 -
 48
48 -
 49
49 -
 50
50 -
 51
51 -
 52
52 -
 53
53 -
 54
54 -
55
-
56
-
57
-
58
-
59
-
60
-
61
-
62
-
63
-
64
-
65
-
66
-
67
-
68
-
69
-
70
-
71
-
72
-
73
-
74
-
75
-
76
-
77
-
78
-
79
-
80
-
81
-
82
-
83
-
84
-
85
-
86
-
87
-
88
-
89
-
90
-
91
-
92
-
93
-
94
-
95
-
96
-
97
-
98
-
99
-
100
-
101
-
102
-
103
-
104
-
105
-
106
-
107
-
108
-
109
-
110
-
111
-
112
 |
 |

29
to their scheduled due dates at a discounted price. Our obligations to suppliers, including amounts due and scheduled
payment dates, are not impacted by suppliers’ decisions to finance our accounts payable due to them under this
arrangement. Our goal in entering into this arrangement is to capture overall supply chain savings in the form of
pricing, payment terms or vendor funding, created by facilitating our suppliers’ ability to finance payment
obligations at more favorable discount rates, while providing them with greater working capital flexibility.
Any deterioration in the credit markets could adversely impact our ability to secure funding for any of these
programs, which would reduce our anticipated savings, including but not limited to, causing us to increase our
borrowings under our revolving credit facility.
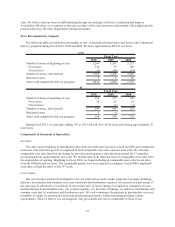
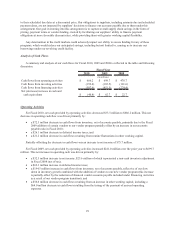
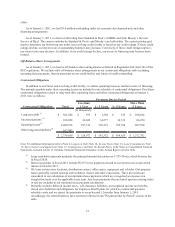
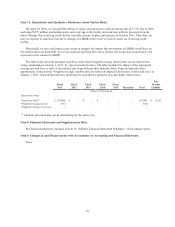
Analysis of Cash Flows
A summary and analysis of our cash flows for Fiscal 2010, 2009 and 2008 is reflected in the table and following
discussion.
2010 2009 2008
Cash flows from operating activities 666.2$ 699.7$ 478.7$
Cash flows from investing activities (199.4) (185.5) (181.6)
Cash flows from financing activities (507.6) (451.5) (274.4)
Net (decrease) increase in cash and
cash equivalents (40.8)$ 62.7$ 22.7$
Fiscal Year
(in millions)
Operating Activities
For Fiscal 2010, net cash provided by operating activities decreased $33.5 million to $666.2 million. This net
decrease in operating cash flow was driven primarily by:
• a $72.3 million decrease in cash flows from inventory, net of accounts payable, primarily due to the Fiscal
2009 addition of certain vendors to our vendor program partially offset by an increase in our accounts
payable ratio in Fiscal 2010;
• a $26.1 million decrease in deferred income taxes; and
• a $21.2 million decrease in cash flows resulting from routine fluctuations in other working capital.
Partially offsetting the decrease in cash flows was an increase in net income of $75.7 million.
For Fiscal 2009, net cash provided by operating activities increased $221.0 million over the prior year to $699.7
million. This net increase in operating cash was driven primarily by:
• a $32.3 million increase in net income, $23.6 million of which represented a non-cash inventory adjustment
in Fiscal 2008 (net of tax);
• a $69.3 million increase in deferred income taxes;
• a $194.5 million increase in cash flows from inventory, net of accounts payable, reflective of our slow
down in inventory growth combined with the addition of vendors to our new vendor program (this increase
is partially offset by the reduction of financed vendor accounts payable included under Financing Activities
as a result of our vendor program transition); and
• a $56.6 million decrease in cash flows resulting from an increase in other working capital, including a
$64.0 million decrease in cash flows resulting from the timing of the payment of accrued operating
expenses.