Advance Auto Parts 2011 Annual Report Download - page 36
Download and view the complete annual report
Please find page 36 of the 2011 Advance Auto Parts annual report below. You can navigate through the pages in the report by either clicking on the pages listed below, or by using the keyword search tool below to find specific information within the annual report.-
 1
1 -
2
-
3
-
4
-
5
-
6
-
7
-
8
-
9
-
10
-
11
-
12
-
13
-
14
-
15
-
16
-
17
-
18
-
19
-
20
-
21
-
22
-
23
-
24
-
25
-
 26
26 -
 27
27 -
 28
28 -
 29
29 -
 30
30 -
 31
31 -
 32
32 -
 33
33 -
 34
34 -
 35
35 -
 36
36 -
 37
37 -
 38
38 -
 39
39 -
 40
40 -
 41
41 -
 42
42 -
 43
43 -
 44
44 -
 45
45 -
 46
46 -
47
-
48
-
49
-
50
-
51
-
52
-
53
-
54
-
55
-
56
-
57
-
58
-
59
-
60
-
61
-
62
-
63
-
64
-
65
-
66
-
67
-
68
-
69
-
70
-
71
-
72
-
73
-
74
-
75
-
76
-
77
-
78
-
79
-
80
-
81
-
82
-
83
-
84
-
85
-
86
-
87
-
88
-
89
-
90
-
91
-
92
-
93
-
94
-
95
-
96
-
97
-
98
-
99
-
100
-
101
-
102
-
103
-
104
-
105
-
106
-
107
-
108
-
109
-
110
-
111
-
112
 |
 |

21
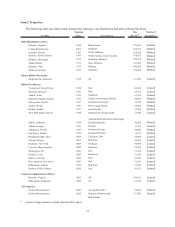
At January 1, 2011, we operated 194 stores in the AI segment under the “Autopart International” trade name.
We acquired AI in September 2005. AI’s business primarily serves the Commercial market from its store locations
in the Northeastern and Mid-Atlantic regions of the United States and Florida. In addition, its North American Sales
Division services warehouse distributors and jobbers throughout North America.
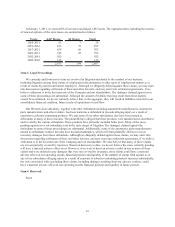
Management Overview
During Fiscal 2010, we produced favorable financial results primarily due to strong comparable store sales
growth, an increase in our gross profit rate and the repurchase of shares of our common stock resulting in earnings
per diluted share, or diluted EPS, of $3.95 compared to $2.83 in Fiscal 2009. Our strong earnings and favorable
management of working capital during Fiscal 2010 have generated significant operating cash flow that allowed us to
invest in business initiatives related to our key strategies and repurchase shares of our common stock.
Although we have presented our financial results in this Form 10-K in conformity with accounting principles
generally accepted in the United States (GAAP), our financial results for Fiscal 2009 and Fiscal 2008 include the
impact of the following significant items. Our Fiscal 2009 results were reduced by an EPS impact of $0.17 resulting
from the closure of 45 stores in connection with our store divestiture plan. Our Fiscal 2008 financial results included
an extra week of operations (53rd week) as well as a non-cash obsolete inventory write-down of $37.5 million due
to a change in inventory management approach for slow moving inventory, or non-cash inventory adjustment. The
impact of the Fiscal 2008 items was a net reduction in EPS of $0.15.
Fiscal 2010 Highlights
Highlights from our Fiscal 2010 include:
Financial
• Total sales during Fiscal 2010 increased 9.5% to $5,925.2 million as compared to Fiscal 2009, primarily
driven by an 8.0% increase in comparable store sales.
• Our gross profit rate increased 113 basis points as compared to Fiscal 2009.
• Our selling, general and administrative, or SG&A, expense rate decreased 35 basis points as compared to
Fiscal 2009, and increased 13 basis points when excluding the impact of store divestiture expenses in Fiscal
2009.
• We generated operating cash flow of $666.2 million during Fiscal 2010, and used available cash to
repurchase 13.0 million shares of our common stock under our stock repurchase plans at a cost of $633.9
million, or an average price of $48.67 per share.
Other
• We issued $300 million of senior unsecured notes in April 2010 with an interest of 5.75% due in 2020.
• Subsequent to the end of Fiscal 2010, we repurchased 1.9 million shares of our common stock, which
completed the availability under our $300 million stock repurchase program. On February 8, 2011 our
Board of Directors authorized a new $500 million stock repurchase program.
Business Update
Our positive financial results in Fiscal 2010 are a result of the investments we have made in each of our four
key strategies over the past three years, the successful execution of the initiatives supporting each of our strategies
and favorable conditions in the automotive aftermarket. Our initial focus on our Commercial Acceleration and
Availability Excellence strategies has resulted in consistent double-digit increases in our Commercial comparable
store sales and strong overall gross profit improvement over this timeframe. Through our DIY Transformation and