Advance Auto Parts 2011 Annual Report Download - page 39
Download and view the complete annual report
Please find page 39 of the 2011 Advance Auto Parts annual report below. You can navigate through the pages in the report by either clicking on the pages listed below, or by using the keyword search tool below to find specific information within the annual report.-
 1
1 -
2
-
3
-
4
-
5
-
6
-
7
-
8
-
9
-
10
-
11
-
12
-
13
-
14
-
15
-
16
-
17
-
18
-
19
-
20
-
21
-
22
-
23
-
24
-
25
-
26
-
27
-
28
-
 29
29 -
 30
30 -
 31
31 -
 32
32 -
 33
33 -
 34
34 -
 35
35 -
 36
36 -
 37
37 -
 38
38 -
 39
39 -
 40
40 -
 41
41 -
 42
42 -
 43
43 -
 44
44 -
 45
45 -
 46
46 -
 47
47 -
 48
48 -
 49
49 -
50
-
51
-
52
-
53
-
54
-
55
-
56
-
57
-
58
-
59
-
60
-
61
-
62
-
63
-
64
-
65
-
66
-
67
-
68
-
69
-
70
-
71
-
72
-
73
-
74
-
75
-
76
-
77
-
78
-
79
-
80
-
81
-
82
-
83
-
84
-
85
-
86
-
87
-
88
-
89
-
90
-
91
-
92
-
93
-
94
-
95
-
96
-
97
-
98
-
99
-
100
-
101
-
102
-
103
-
104
-
105
-
106
-
107
-
108
-
109
-
110
-
111
-
112
 |
 |

24
competitors due to differences in industry practice regarding the classification of certain costs. See Note 2 to our
consolidated financial statements elsewhere in this report for additional discussion of these costs.
Selling, General and Administrative Expenses
SG&A expenses consist of store payroll, store occupancy (including rent and depreciation), advertising
expenses, Commercial delivery expenses, other store expenses and general and administrative expenses, including
salaries and related benefits of store support center Team Members, share-based compensation expense, store
support center administrative office expenses, data processing, professional expenses, self-insurance costs, closed
store expense, impairment charges, if any, and other related expenses. See Note 2 to our consolidated financial
statements for additional discussion of these costs.
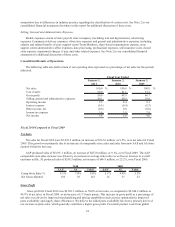
Consolidated Results of Operations
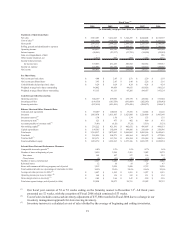
The following table sets forth certain of our operating data expressed as a percentage of net sales for the periods
indicated.
January 1, January 2, January 3,
2011 2010 2009
Net sales 100.0 % 100.0 % 100.0 %
Cost of sales 50.0 51.1 53.3
Gross profit 50.0 48.9 46.7
Selling, general and administrative expenses 40.1 40.5 38.6
Operating income 9.9 8.4 8.1
Interest expense (0.5) (0.4) (0.7)
Other income, net (0.0) 0.0 (0.0)
Income tax expense 3.6 3.0 2.8
Net income 5.8 5.0 4.6
Fiscal Year Ended
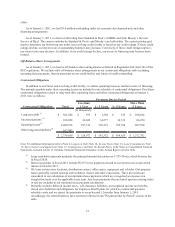
Fiscal 2010 Compared to Fiscal 2009
Net Sales
Net sales for Fiscal 2010 were $5,925.2 million, an increase of $512.6 million, or 9.5%, over net sales for Fiscal
2009. This growth was primarily due to an increase in comparable store sales and sales from new AAP and AI stores
opened within the last year.
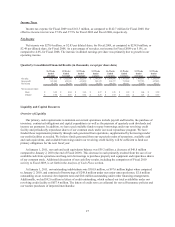
AAP produced sales of $5,691.1 million, an increase of $472.8 million, or 9.1%, over Fiscal 2009. The AAP
comparable store sales increase was driven by an increase in average ticket sales as well as an increase in overall
customer traffic. AI produced sales of $249.5 million, an increase of $46.9 million, or 23.2%, over Fiscal 2009.
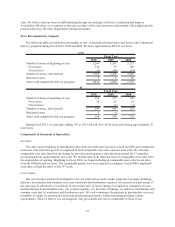
AAP AI Total AAP AI Total
Comp Store Sales % 8.1% 7.0% 8.0% 5.1% 9.9% 5.3%
Net Stores Opened 105 38 143 21 31 52
2010 2009
Gross Profit
Gross profit for Fiscal 2010 was $2,961.3 million, or 50.0% of net sales, as compared to $2,644.2 million, or
48.9% of net sales, in Fiscal 2009, or an increase of 113 basis points. This increase in gross profit as a percentage of
net sales was driven by improved merchandising and pricing capabilities (such as price optimization), improved
parts availability and supply chain efficiencies. We believe the added parts availability has been a primary driver of
our increase in parts sales, which generally contribute a higher gross profit. Favorable product costs from global