Advance Auto Parts 2011 Annual Report Download - page 34
Download and view the complete annual report
Please find page 34 of the 2011 Advance Auto Parts annual report below. You can navigate through the pages in the report by either clicking on the pages listed below, or by using the keyword search tool below to find specific information within the annual report.-
 1
1 -
2
-
3
-
4
-
5
-
6
-
7
-
8
-
9
-
10
-
11
-
12
-
13
-
14
-
15
-
16
-
17
-
18
-
19
-
20
-
21
-
22
-
23
-
 24
24 -
 25
25 -
 26
26 -
 27
27 -
 28
28 -
 29
29 -
 30
30 -
 31
31 -
 32
32 -
 33
33 -
 34
34 -
 35
35 -
 36
36 -
 37
37 -
 38
38 -
 39
39 -
 40
40 -
 41
41 -
 42
42 -
 43
43 -
 44
44 -
45
-
46
-
47
-
48
-
49
-
50
-
51
-
52
-
53
-
54
-
55
-
56
-
57
-
58
-
59
-
60
-
61
-
62
-
63
-
64
-
65
-
66
-
67
-
68
-
69
-
70
-
71
-
72
-
73
-
74
-
75
-
76
-
77
-
78
-
79
-
80
-
81
-
82
-
83
-
84
-
85
-
86
-
87
-
88
-
89
-
90
-
91
-
92
-
93
-
94
-
95
-
96
-
97
-
98
-
99
-
100
-
101
-
102
-
103
-
104
-
105
-
106
-
107
-
108
-
109
-
110
-
111
-
112
 |
 |

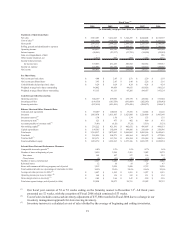
19
2010 2009 2008 2007 2006
Statement of Operations Data:
Net sales 5,925,203$ 5,412,623$ 5,142,255$ 4,844,404$ 4,616,503$
Cost of sales
(
2
)
2,963,888 2,768,397 2,743,131 2,585,665 2,472,203
Gross profit 2,961,315 2,644,226 2,399,124 2,258,739 2,144,300
Selling, general and administrative expenses 2,376,382 2,189,841 1,984,197 1,842,310 1,740,950
Operating income 584,933 454,385 414,927 416,429 403,350
Interest expense (26,861) (23,337) (33,729) (34,809) (35,992)
Gain on extinguishment of debt - - - - 986
Other income (expense), net (1,017) 607 (506) 1,014 1,571
Income before provision
for income taxes 557,055 431,655 380,692 382,634 369,915
Income tax expense 211,002 161,282 142,654 144,317 138,597
Net income 346,053 270,373 238,038 238,317 231,318
Per Share Data:
Net income per basic share 4.00$ 2.85$ 2.51$ 2.29$ 2.18$
Net income per diluted share 3.95$ 2.83$ 2.49$ 2.28$ 2.16$
Cash dividends declared per basic share 0.24$ 0.24$ 0.24$ 0.24$ 0.24$
Weighted average basic shares outstanding 86,082 94,459 94,655 103,826 106,129
Weighted average diluted shares outstanding 87,155 95,113 95,205 104,637 107,124
Cash flows provided by (used in):
Operating activities 666,159$ 699,690$ 478,739$ 410,542$ 333,604$
Investing activities (199,350) (185,539) (181,609) (202,143) (258,642)
Financing activities (507,618) (451,491) (274,426) (204,873) (104,617)
Balance Sheet and Other Financial Data:
Cash and cash equivalents 59,209$ 100,018$ 37,358$ 14,654$ 11,128$
Inventory 1,863,870$ 1,631,867$ 1,623,088$ 1,529,469$ 1,463,340$
Inventory turnover
(3)
1.70 1.70 1.74 1.73 1.75
Inventory per store
(
4
)
523$ 477$ 482$ 469$ 475$
Accounts payable to inventory ratio
(
5
)
71.0% 61.2% 57.2% 55.1% 53.2%
Net working capital
(
6
)
276,222$ 421,591$ 442,632$ 456,897$ 498,553$
Capital expenditures 199,585$ 192,934$ 184,986$ 210,600$ 258,586$
Total assets 3,354,217$ 3,072,963$ 2,964,065$ 2,805,566$ 2,682,681$
Total debt 301,824$ 204,271$ 456,164$ 505,672$ 477,240$
Total net debt
(
7
)
252,171$ 113,781$ 439,394$ 521,018$ 500,318$
Total stockholders' equity 1,039,374$ 1,282,365$ 1,075,166$ 1,023,795$ 1,030,854$
Selected Store Data and Performance Measures:
Comparable store sales growth
(
8
)
8.0% 5.3% 1.5% 0.7% 1.6%
Number of stores at beginning of year 3,420 3,368 3,261 3,082 2,872
New stores 148 107 127 196 215
Closed stores (5) (55) (20) (17) (5)
Number of stores, end of period 3,563 3,420 3,368 3,261 3,082
Relocated stores 12 10 10 29 47
Stores with commercial delivery program, end of period 3,212 3,024 2,880 2,712 2,526
Total commercial sales, as a percentage of total sales (in 000s) 34.2% 32.0% 29.5% 26.6% 25.0%
Average net sales per store (in 000s)
(9)
1,697$ 1,595$ 1,551$ 1,527$ 1,551$
Operating income per store (in 000s)
(
10
)
168$ 134$ 125$ 131$ 135$
Gross margin return on inventory
(11)
5.05$ 3.98$ 3.47$ 3.29$ 3.29$
Total store square footage, end of period (in 000s) 25,950 24,973 24,711 23,982 22,753
Fiscal Year
(1)
(in thousands, except per share data, store data and ratios)
(1) Our fiscal year consists of 52 or 53 weeks ending on the Saturday nearest to December 31st. All fiscal years
presented are 52 weeks, with the exception of Fiscal 2008 which consisted of 53 weeks.
(2) Cost of sales includes a non-cash inventory adjustment of $37,500 recorded in Fiscal 2008 due to a change in our
inventory management approach for slow moving inventory.
(3) Inventory turnover is calculated as cost of sales divided by the average of beginning and ending inventories.