Advance Auto Parts 2011 Annual Report Download - page 61
Download and view the complete annual report
Please find page 61 of the 2011 Advance Auto Parts annual report below. You can navigate through the pages in the report by either clicking on the pages listed below, or by using the keyword search tool below to find specific information within the annual report.-
 1
1 -
2
-
3
-
4
-
5
-
6
-
7
-
8
-
9
-
10
-
11
-
12
-
13
-
14
-
15
-
16
-
17
-
18
-
19
-
20
-
21
-
22
-
23
-
24
-
25
-
26
-
27
-
28
-
29
-
30
-
31
-
32
-
33
-
34
-
35
-
36
-
37
-
38
-
39
-
40
-
41
-
42
-
43
-
44
-
45
-
46
-
47
-
48
-
49
-
50
-
 51
51 -
 52
52 -
 53
53 -
 54
54 -
 55
55 -
 56
56 -
 57
57 -
 58
58 -
 59
59 -
 60
60 -
 61
61 -
 62
62 -
 63
63 -
 64
64 -
 65
65 -
 66
66 -
 67
67 -
 68
68 -
 69
69 -
 70
70 -
 71
71 -
72
-
73
-
74
-
75
-
76
-
77
-
78
-
79
-
80
-
81
-
82
-
83
-
84
-
85
-
86
-
87
-
88
-
89
-
90
-
91
-
92
-
93
-
94
-
95
-
96
-
97
-
98
-
99
-
100
-
101
-
102
-
103
-
104
-
105
-
106
-
107
-
108
-
109
-
110
-
111
-
112
 |
 |

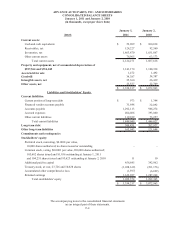
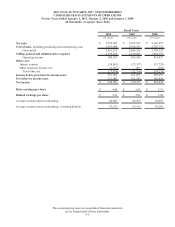
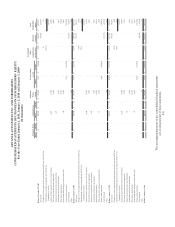
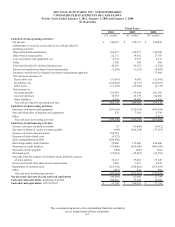
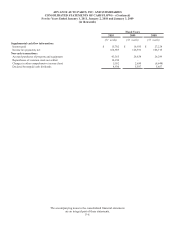
ADVANCE AUTO PARTS, INC. AND SUBSIDIARIES
CONSOLIDATED STATEMENTS OF CASH FLOWS
For the Years Ended January 1, 2011, January 2, 2010 and January 3, 2009
(in thousands)
The accompanying notes to the consolidated financial statements
are an integral part of these statements.
F-7
2010 2009 2008
(52 weeks) (52 weeks) (53 weeks)
Cash flows from operating activities:
Net income 346,053$ 270,373$ 238,038$
Adjustments to reconcile net income to net cash provided by
operating activities:
Depreciation and amortization 164,437 150,917 146,580
Share-based compensation 22,311 19,682 17,707
Loss on property and equipment, net 6,534 8,975 2,232
Other 1,106 360 360
Provision (benefit) for deferred income taxes 40,503 66,622 (2,702)
Excess tax benefit from share-based compensation (7,260) (3,219) (9,047)
Inventory write-down for change in inventory management approach - - 37,484
Net (increase) decrease in:
Receivables, net (31,667) 4,643 (11,943)
Inventories, net (232,003) (8,779) (130,657)
Other assets (13,105) (15,694) (6,178)
Net increase in:
Accounts payable 325,839 174,944 102,360
Accrued expenses 38,715 20,778 84,806
Other liabilities 4,696 10,088 9,699
Net cash provided by operating activities 666,159 699,690 478,739
Cash flows from investing activities:
Purchases of property and equipment (199,585) (192,934) (184,986)
Proceeds from sales of property and equipment 235 7,395 6,790
Other - - (3,413)
Net cash used in investing activities (199,350) (185,539) (181,609)
Cash flows from financing activities:
Increase (decrease) in bank overdrafts 28 (11,060) (9,412)
Decrease in financed vendor accounts payable (444) (104,294) (17,163)
Issuance of senior unsecured notes 298,761 - -
Payment of debt related costs (4,572) -
-
Early extinguishment of debt (200,000) - -
Borrowings under credit facilities 75,000 173,400 438,600
Payments on credit facilities (75,000) (424,900) (488,100)
Payments on note payable (704) (685) (666)
Dividends paid (21,051) (22,803) (23,181)
Proceeds from the issuance of common stock, primarily exercise
of stock options 36,113 35,402 35,220
Excess tax benefit from share-based compensation 7,260 3,219 9,047
Repurchase of common stock (622,442) (100,062) (219,429)
Other (567) 292 658
Net cash used in financing activities (507,618) (451,491) (274,426)
Net (decrease) increase in cash and cash equivalents (40,809) 62,660 22,704
Cash and cash equivalents, beginning of period 100,018 37,358 14,654
Cash and cash equivalents, end of period 59,209$ 100,018$ 37,358$
Fiscal Years