Advance Auto Parts 2011 Annual Report Download - page 20
Download and view the complete annual report
Please find page 20 of the 2011 Advance Auto Parts annual report below. You can navigate through the pages in the report by either clicking on the pages listed below, or by using the keyword search tool below to find specific information within the annual report.-
 1
1 -
2
-
3
-
4
-
5
-
6
-
7
-
8
-
9
-
 10
10 -
 11
11 -
 12
12 -
 13
13 -
 14
14 -
 15
15 -
 16
16 -
 17
17 -
 18
18 -
 19
19 -
 20
20 -
 21
21 -
 22
22 -
 23
23 -
 24
24 -
 25
25 -
 26
26 -
 27
27 -
 28
28 -
 29
29 -
 30
30 -
31
-
32
-
33
-
34
-
35
-
36
-
37
-
38
-
39
-
40
-
41
-
42
-
43
-
44
-
45
-
46
-
47
-
48
-
49
-
50
-
51
-
52
-
53
-
54
-
55
-
56
-
57
-
58
-
59
-
60
-
61
-
62
-
63
-
64
-
65
-
66
-
67
-
68
-
69
-
70
-
71
-
72
-
73
-
74
-
75
-
76
-
77
-
78
-
79
-
80
-
81
-
82
-
83
-
84
-
85
-
86
-
87
-
88
-
89
-
90
-
91
-
92
-
93
-
94
-
95
-
96
-
97
-
98
-
99
-
100
-
101
-
102
-
103
-
104
-
105
-
106
-
107
-
108
-
109
-
110
-
111
-
112
 |
 |

5
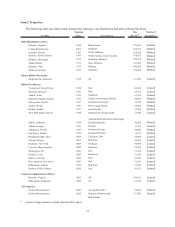
Our 3,369 AAP stores were located in the following states and territories at January 1, 2011:
Number of Number of Number of
Location Stores Location Stores Location Stores
Alabama 120 Maryland 77 Pennsylvania 173
Arkansas 28 Massachusetts 65 Puerto Rico 25
Colorado 49 Michigan 106 Rhode Island 10
Connecticut 39 Minnesota 14 South Carolina 128
Delaware 7 Mississippi 56 South Dakota 7
Florida 460 Missouri 43 Tennessee 138
Georgia 232 Nebraska 21 Texas 172
Illinois 96 New Hampshire 13 Vermont 8
Indiana 104 New Jersey 58 Virgin Islands 1
Iowa 27 New Mexico 1 Virginia 172
Kansas 25 New York 129 West Virginia 66
Kentucky 99 North Carolina 241 Wisconsin 49
Louisiana 61 Ohio 201 Wyoming 3
Maine 14 Oklahoma 31
The following table sets forth information concerning increases in the total number of our AAP stores during
the past five years:
2010 2009 2008 2007 2006
Beginning Stores 3,264 3,243 3,153 2,995 2,810
New Stores
(1)
110 75 109 175 190
Stores Closed (5) (54) (19) (17) (5)
Ending Stores
(2)
3,369 3,264 3,243 3,153 2,995
(1) Does not include stores that opened as relocations of previously existing stores within the same general market area
or substantial renovations of stores.
(2) Includes 2 stores not operating at December 30, 2006, primarily due to hurricane damage.
Store Technology. Our store-based information systems, which are designed to improve the efficiency of our
operations and enhance customer service, are comprised of a proprietary POS system and electronic parts catalog, or
EPC, system. Information maintained by our POS system is used to formulate pricing, marketing and
merchandising strategies and to replenish inventory accurately and rapidly. Our POS system is fully integrated with
our EPC system and enables our store Team Members to assist our customers in their parts selection and ordering
based on the year, make, model and engine type of their vehicles. Our centrally-based EPC data management system
enables us to reduce the time needed to (i) exchange data with our vendors and (ii) catalog and deliver updated,
accurate parts information.
Our EPC system also contains enhanced search engines and user-friendly navigation tools that enhance our
Team Members’ ability to look up any needed parts as well as additional products the customer needs to complete
an automotive repair project. If a hard-to-find part or accessory is not available at one of our stores, the EPC system
can determine whether the part is carried and in-stock through our PDQ system. Available parts and accessories are
then ordered electronically from another store, PDQ or Master PDQ with immediate confirmation of price,
availability and estimated delivery time.
We also support our store operations with additional proprietary systems and customer driven labor scheduling
capabilities. Our store-level inventory management system provides real-time inventory tracking at the store level.