Abercrombie & Fitch 2006 Annual Report Download - page 8
Download and view the complete annual report
Please find page 8 of the 2006 Abercrombie & Fitch annual report below. You can navigate through the pages in the report by either clicking on the pages listed below, or by using the keyword search tool below to find specific information within the annual report.-
 1
1 -
 2
2 -
 3
3 -
 4
4 -
 5
5 -
 6
6 -
 7
7 -
 8
8 -
 9
9 -
 10
10 -
 11
11 -
 12
12 -
 13
13 -
 14
14 -
 15
15 -
 16
16 -
 17
17 -
 18
18 -
 19
19 -
20
-
21
-
22
-
23
-
24
 |
 |

Abercrombie &Fitch
refresh existing stores. The store refresh will include new floors, sound
systems and fixture replacements at Abercrombie & Fitch and aber-
crombie stores. In addition, the store refresh will include the addition of
video walls at existing Hollister stores and fixtures to stores
throughout the Hollister chain. The Company is planning approxi-
mately $85 million in capital expenditures at the home office related
to new office buildings, information technology investment and new
direct-to-consumer distribution and logistics systems. In March 2007,
the Company decided to allocate approximately $35 million for the
purchase of an airplane. With planned expansion in Europe and Asia
over the next several years, the Company concluded that acquiring a plane
is more beneficial than continuing multiple fractional share ownership
programs in meeting the business travel needs of its Chief Executive
Officer and senior management team.
The following measurements are among the key business indicators
reviewed by various members of management to gauge the Company’s
results:
I
Comparable store sales by brand, by product and by store, defined
as year-over-year sales for a store that has been open as the same
brand at least one year and its square footage has not been expanded
or reduced by more than 20% within the past year;
I
IMU;
I
Selling margin, defined as sales price less original cost, by brand and
by product category;
I
Store metrics such as sales per gross square foot, average unit retail,
average transaction values, store contribution (defined as store
sales less direct costs of running the store) and average units per
transaction;
I
Markdown rate;
I
Gross profit rate;
I
Operating income;
I
Net income;
I
Inventory per gross square foot; and
I
Cash flow and liquidity determined by the Company’s current ratio
and cash provided by operations.
While not all of these metrics are disclosed publicly by the Company,
due to the proprietary nature of the information, the Company publicly
discloses and discusses several of these metrics as part of its financial summa-
ry and in several sections of this Management’s Discussion and Analysis.
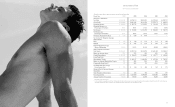
FISCAL 2006 COMPARED TO FISCAL 2005: FOURTH
QUARTER RESULTS: NET SALES
Net sales for the fourth
quarter of Fiscal 2006 were $1.139 billion, up 18.5% versus last year’s
fourth quarter net sales of $961.4 million. The net sales increase was
primarily attributed to the net addition of 93 stores, including the full
quarter impact of the Abercrombie & Fitch Fifth Avenue Flagship
store and six stores in Canada; a 58% increase in direct-to-consumer
business (including shipping and handling revenue); and a fourteen
week quarter in Fiscal 2006 versus a thirteen week quarter in Fiscal
2005, partially offset by a 3% decrease in comparable store sales.
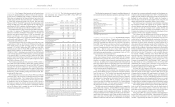
Comparable store sales by brand for the fourth quarter of Fiscal
2006 versus the same quarter in Fiscal 2005 were as follows:
Abercrombie & Fitch decreased 6% with women’s comparable store
sales decreasing by a high single-digit and mens decreasing by a mid
single-digit; abercrombie increased 2% with boys achieving a mid sin-
gle-digit increase and girls flat; Hollister was flat with bettys flat and
dudes posting a decrease in the low single-digits; and RUEHL
increased 6% with womens realizing a mid single-digit increase and
mens posting a low single-digit increase.
On a regional basis, comparable store sales for the Company ranged
from decreases in the high single-digits to increases in the low single-
digits. Stores located in the New York and Mid-Atlantic regions had
the strongest comparable store sales performance and stores located in
the West region had the weakest comparable store sales performance
on a consolidated basis.
From a merchandise classification standpoint across all brands,
stronger performing masculine categories included fleece, knit tops
and underwear, while jeans, pants and sweaters posted negative
comparable store sales. In the feminine businesses, across all brands,
stronger performing categories included knit tops, fleece and shorts,
while jeans, skirts and pants posted negative comparable store sales.
Direct-to-consumer merchandise net sales, which are sold through
the Company’s web sites and catalogue, in the fourth quarter of
Fiscal 2006 were $74.8 million, an increase of 57.5% versus last year’s
fourth quarter net sales of $47.5 million. Shipping and handling
revenue for the corresponding periods was $9.8 million in Fiscal 2006
and $6.2 million in Fiscal 2005. The direct-to-consumer business,
including shipping and handling revenue, accounted for 7.4% of net
sales in the fourth quarter of Fiscal 2006 compared to 5.6% in the
fourth quarter of Fiscal 2005.
GROSS PROFIT Gross profit during the fourth quarter of Fiscal
2006 was $755.6 million compared to $639.4 million in Fiscal 2005.
The gross profit rate (gross profit divided by net sales) for the fourth
quarter of Fiscal 2006 was 66.4%, down 10 basis points from last
year’s fourth quarter rate of 66.5%. The decrease in gross profit rate
largely resulted from higher shrink and a slightly higher markdown
rate compared to the fourth quarter of Fiscal 2005. Abercrombie &
Fitch, abercrombie and Hollister all operated at similar IMU levels.
The Company is targeting RUEHL IMU parity with the other
brands by the end of Fiscal 2007.
STORES AND DISTRIBUTION EXPENSE Stores and distribu-
tion expense for the fourth quarter of Fiscal 2006 was $349.8 million
compared to $293.5 million for the comparable period in Fiscal 2005.
The stores and distribution expense rate (stores and distribution
expense divided by net sales) for the fourth quarter of Fiscal 2006 was
30.7% up 20 basis points from 30.5% in the fourth quarter of Fiscal
2005. The increase in rate is primarily related to additional DC
expenses associated with the second DC, which became fully opera-
tional in the fourth quarter, and direct-to-consumer expenses, which
increased due to higher internet sales as a percentage of total sales.
These increases were partially offset by decreased store expenses as a
percentage of sales. Selling payroll, driven by management salary
increases, state minimum wage increases and additional floor cover-
age to address shrink concerns increased as a percentage of sales.
However, the increase in selling payroll was more than offset by lever-
aging other store related controllable expenses.
The DC productivity level, measured in units processed per labor
hour (“UPH”), was 9% higher in the fourth quarter of Fiscal 2006 ver-
sus the fourth quarter of Fiscal 2005. The UPH rate increase was due to
the second DC becoming fully operational during the fourth quarter.
The Company expects the UPH level to increase during Fiscal 2007.
MARKETING,GENERAL AND ADMINISTRATIVE EXPENSE
Marketing, general and administrative expense during the fourth quar-
ter of Fiscal 2006 was $101.6 million compared to $80.8 million during
the same period in Fiscal 2005. For the fourth quarter of Fiscal 2006, the
marketing, general and administrative expense rate (marketing, general
and administrative expense divided by net sales) was 8.9% compared to
8.4% in the fourth quarter of Fiscal 2005. The increase in the marketing,
general and administrative expense rate was due to higher home office
payroll and consulting expenses.
OTHER OPERATING INCOME, NET Fourth quarter net other
operating income for Fiscal 2006 was $4.6 million compared to $2.3
million for the fourth quarter of Fiscal 2005. Other operating income
primarily related to the gift cards for which the Company has determined
the likelihood of redemption to be remote.
OPERATING INCOME Operating income during the fourth quar-
ter of Fiscal 2006 increased to $308.8 million from $267.5 million in
Fiscal 2005, an increase of 15.4%. The operating income rate (operating
income divided by net sales) for the fourth quarter of Fiscal 2006 was
27.1% compared to 27.8% for the fourth quarter of Fiscal 2005.
INTEREST INCOME, NET AND INCOME TAXES Fourth quar-
ter net interest income was $4.7 million in Fiscal 2006 compared to
$2.4 million during the comparable period in Fiscal 2005. The
increase in net interest income was due to higher interest rates and
higher available investment balances during the fourth quarter of
Fiscal 2006 when compared to the fourth quarter of Fiscal 2005.
The effective tax rate for the fourth quarter of Fiscal 2006 was
36.8% as compared to 39.0% for the Fiscal 2005 comparable period.
The decrease in the effective tax rate was primarily related to favorable
settlements of tax audits during the fourth quarter and the change in
estimates of potential outcomes of certain state tax matters.
NET INCOME AND NET INCOME PER SHARE Net income for
the fourth quarter of Fiscal 2006 was $198.2 million versus $164.6 mil-
lion for the fourth quarter of Fiscal 2005, an increase of 20.4%. Net
income per diluted weighted-average share outstanding for the fourth
quarter of Fiscal 2006 was $2.14, including $0.01 related to SFAS 123(R),
versus $1.80 for the same period last year, an increase of 18.9%.
FISCAL 2006 RESULTS: NET SALES Net sales for Fiscal 2006
were $3.318 billion, an increase of 19.1% versus Fiscal 2005 net sales of
$2.785 billion. The net sales increase was attributed to the combination
of the net addition of 93 stores, including the full year impact of the
Abercrombie & Fitch Fifth Avenue Flagship store and six stores in Canada;
a 2% comparable store sales increase; a 42% increase in direct-to-consumer
business (including shipping and handling revenue); and a fifty-three week
year in Fiscal 2006 versus a fifty-two week year in Fiscal 2005.
For Fiscal 2006, comparable store sales by brand were as follows:
Abercrombie & Fitch decreased 4%; abercrombie increased 10%; Hollister
increased 5%; and RUEHL increased 14%. In addition, the women’s,
girls’ and bettys’ businesses continued to be more significant than the
mens, boys and dudes. During Fiscal 2006, women, girls and bettys
represented over 60% of the net sales for each of their corresponding
brands. Comparable store sales by brand for the year for womens, girls
and bettys were as follows: RUEHL women increased by the high
fifties; Hollister bettys posted a mid-twenties increase; abercrombie
girls had a mid-teens increase; and Abercrombie & Fitch women had
a low single-digit increase.
Direct-to-consumer merchandise net sales in Fiscal 2006 were
$174.1 million, an increase of 42.1% versus last year’s net sales of
$122.5 million for the comparable period. Shipping and handling
revenue was $24.9 million in Fiscal 2006 and $17.6 million in Fiscal 2005.
The direct-to-consumer business, including shipping and handling
revenue, accounted for 6.0% of net sales in Fiscal 2006 compared to
5.0% of net sales in Fiscal 2005.
GROSS PROFIT For Fiscal 2006, gross profit increased to $2.209 bil-
lion from $1.851 billion in Fiscal 2005. The gross profit rate for Fiscal 2006
was 66.6% versus 66.5% the previous year, an increase of 10 basis points.
STORES AND DISTRIBUTION EXPENSE Stores and distribution
Abercrombie &Fitch
14 15