Abercrombie & Fitch 2006 Annual Report Download - page 15
Download and view the complete annual report
Please find page 15 of the 2006 Abercrombie & Fitch annual report below. You can navigate through the pages in the report by either clicking on the pages listed below, or by using the keyword search tool below to find specific information within the annual report.-
 1
1 -
2
-
3
-
4
-
 5
5 -
 6
6 -
 7
7 -
 8
8 -
 9
9 -
 10
10 -
 11
11 -
 12
12 -
 13
13 -
 14
14 -
 15
15 -
 16
16 -
 17
17 -
 18
18 -
 19
19 -
 20
20 -
 21
21 -
 22
22 -
 23
23 -
 24
24
 |
 |
Abercrombie &Fitch
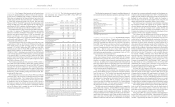
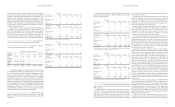
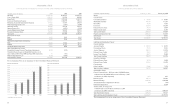
CONSOLIDATED STATEMENTS OF CASH FLOWS
(Thousands) 2006* 2005 2004
Operating Activities:
Net Income $422,186 $333,986 $216,376
Impact of Other Operating Activities on Cash Flows:
Depreciation and Amortization 146,156 124,206 105,814
Amortization of Deferred Lease Credits (34,485) (32,527) (32,794)
Share-Based Compensation 35,119 24,124 10,372
Tax Benefit from Share-Based Compensation 5,472 52,709 17,308
Excess Tax Benefit from Share-Based Compensation (3,382) ––
Deferred Taxes (11,638) (2,099) 3,942
Non-cash Charge for Asset Impairment 298 272 1,190
Loss on Disposal of Assets 6,261 7,386 4,664
Lessor Construction Allowances 49,387 42,336 55,009
Changes in Assets and Liabilities:
Inventories (61,940) (146,314) (34,445)
Accounts Payable and Accrued Expenses 24,579 (2,912) 99,388
Income Taxes (12,805) 43,893 1,659
Other Assets and Liabilities 16,963 8,530 (24,699)
Net Cash Provided by Operating Activities 582,171 453,590 423,784
Investing Activities:
Capital Expenditures (403,476) (256,422) (185,065)
Purchases of Trust Owned Life Insurance Policies (15,258) ––
Purchases of Marketable Securities (1,459,835) (1,016,986) (4,314,070)
Proceeds of Sales of Marketable Securities 1,404,805 605,101 4,778,770
Net Cash (Used for) Provided by Investing Activities (473,764) (668,307) 279,635
Financing Activities:
Dividends Paid (61,623) (52,218) (46,438)
Change in Outstanding Checks and Other (31,770) 8,467 19,383
Proceeds from Share-Based Compensation 12,876 73,716 49,948
Excess Tax Benefit from Share-Based Compensation 3,382 ––
Purchase of Treasury Stock – (103,296) (434,658)
Net Cash Used For Financing Activities (77,135)
(73,331)
(411,765)
Net Increase (Decrease) in Cash and Equivalents 31,272
(288,048)
291,654
Cash and Equivalents, Beginning of Year 50,687 338,735 47,081
Cash and Equivalents, End of Year $ 81,959 $ 50,687 $338,735
Significant Non-Cash Investing Activities:
Change in Accrual for Construction in Progress $ 28,455 $ 3,754 $(15,513)
* Fiscal 2006 is a fifty-three week year.
The accompanying Notes are an integral part of these Consolidated Financial Statements.
29
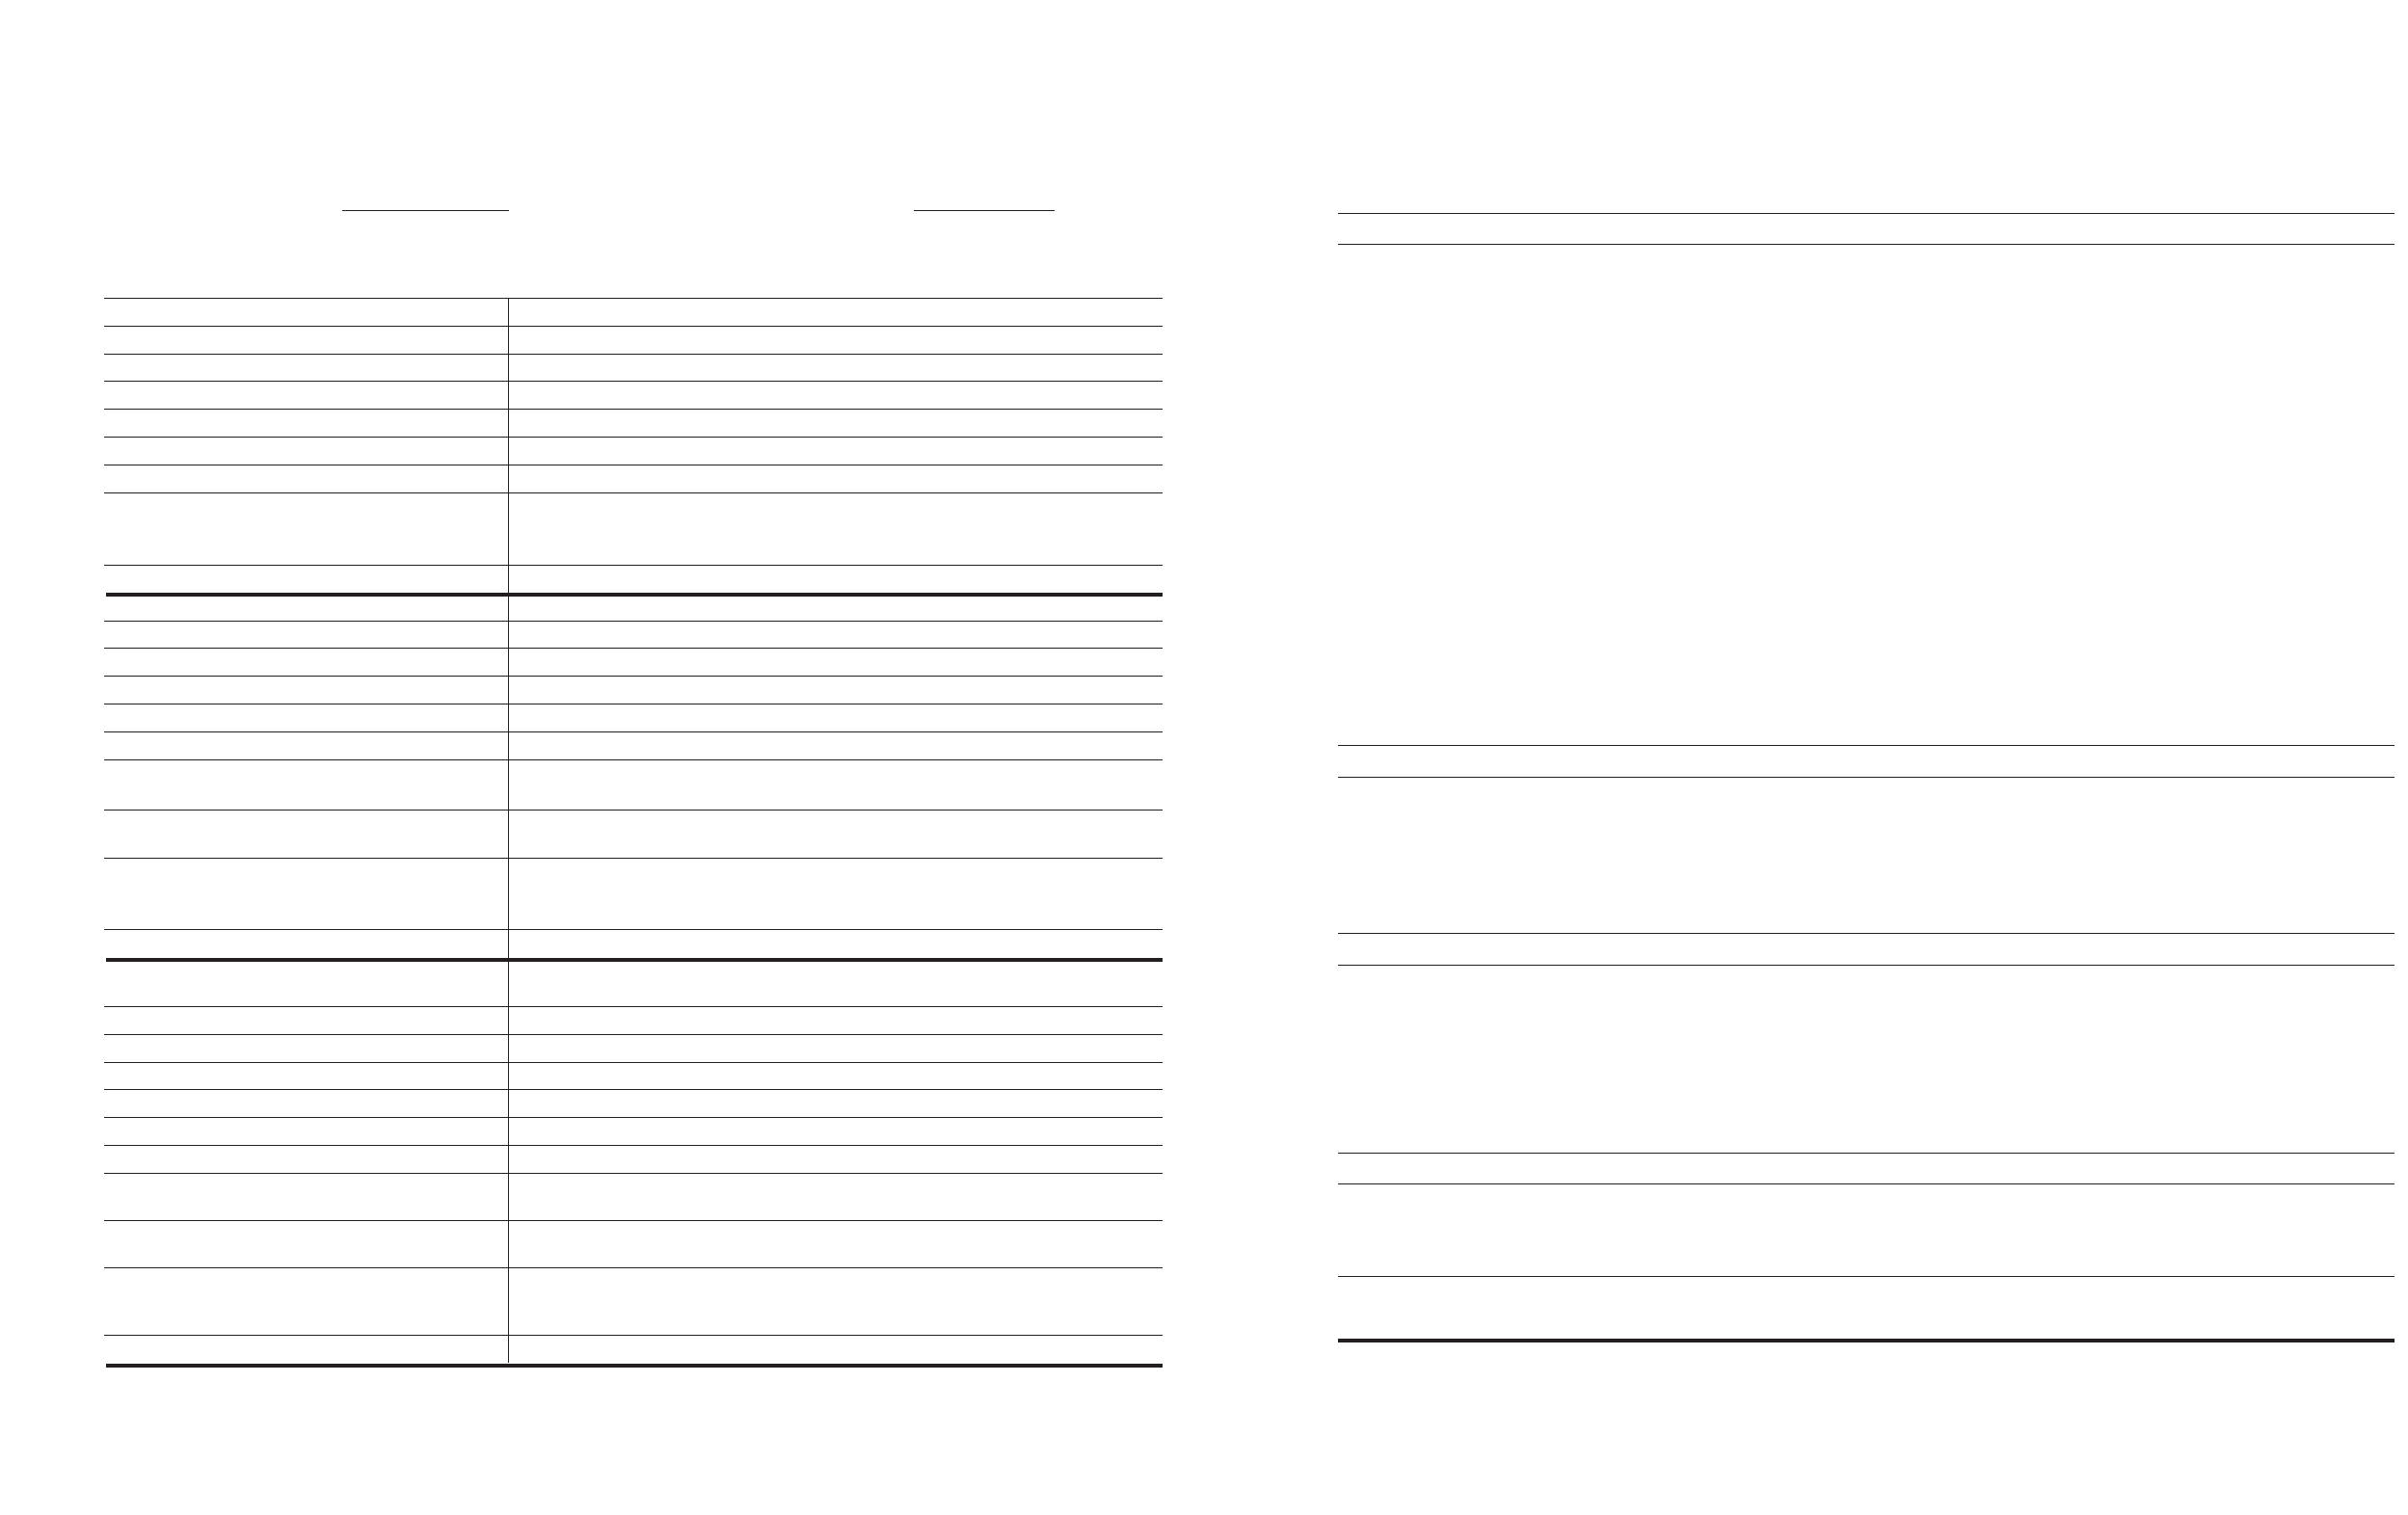
Abercrombie &Fitch
CONSOLIDATED STATEMENTS OF SHAREHOLDERS’ EQUITY
Common Stock Treasury Stock
Other
Deferred Compre- Total
Shares Par Paid-In Retained Compen- hensive At Average Shareholders’
(Thousands) Outstanding Value Capital Earnings sation Income Shares Cost Equity
Balance, January 31, 2004 94,607 $1,033 $159,244 $ 885,980 $ 6,265 – 8,692 $(194,758) $ 857,764
Purchase of Treasury Stock (11,151) – – – – – 11,151 (434,658) (434,658)
Net Income – – – 216,376 – – – – 216,376
Restricted Stock Unit Issuance 24 – – 108 (1,578) – (24) 542 (928)
Restricted Stock Unit Expense – – – – 10,361 – – – 10,361
Stock Option Exercises 2,556 – – (16,304) – – (2,556) 65,845 49,541
Dividends ($0.50 per share) – – – (46,438) – – – – (46,438)
Tax Benefit from Exercise of
Stock Options and Issuance of
Restricted Stock Units – – 17,308 – – – – – 17,308
Balance, January 29, 2005 86,036 $1,033 $176,552 $1,039,722 $15,048 – 17,263 $(563,029) $ 669,326
Purchase of Treasury Stock (1,765) – – – – – 1,765 (103,296) (103,296)
Net Income – – – 333,986 – – – – 333,986
Restricted Stock Unit Issuance 166 – – (4,297) (12,966) – (166) 5,650 (11,613)
Restricted Stock Unit Expense – – – – 24,124 – – – 24,124
Stock Option Exercises 3,289 – – (26,985) – – (3,289) 109,880 82,895
Dividends ($0.60 per share) – – – (52,218) – – – – (52,218)
Unrealized Losses
on Marketable Securities – – – – – (718) – – (718)
Cumulative Foreign Currency
Translation Adjustments – – – – – (78) – – (78)
Tax Benefit from Exercise of
Stock Options and Issuance of
Restricted Stock Units – – 52,709 – – – – – 52,709
Balance, January 28, 2006 87,726 $1,033 $229,261 $1,290,208 $26,206 $(796) 15,574 $(550,795) $ 995,117
Deferred Compensation
Reclassification – – 26,206 – (26,206) – – – –
Net Income – – – 422,186 – – – – 422,186
Restricted Stock Unit Issuance 145 – (7,710) (1,011) – – (145) 4,302 (4,419)
Restricted Stock Unit Expense – – 19,964 – – – – – 19,964
Stock Option Exercises 429 – 1,384 (3,470) – – (429) 15,729 13,643
Stock Option Expense – – 15,155 – – – – – 15,155
Dividends ($0.70 per share) – – – (61,623) – – – – (61,623)
Unrealized Gains on
Marketable Securities – – – – – 41 – – 41
Cumulative Foreign Currency
Translation Adjustments – – – – – (239) – – (239)
Tax Benefit from Exercise of
Stock Options and Issuance of
Restricted Stock Units – – 5,472 – – – – – 5,472
Balance, February 3, 2007 88,300 $1,033 $289,732 $1,646,290 – $(994) 15,000 $(530,764) $1,405,297
The accompanying Notes are an integral part of these Consolidated Financial Statements.
28