Abercrombie & Fitch 2006 Annual Report Download - page 14
Download and view the complete annual report
Please find page 14 of the 2006 Abercrombie & Fitch annual report below. You can navigate through the pages in the report by either clicking on the pages listed below, or by using the keyword search tool below to find specific information within the annual report.-
 1
1 -
2
-
3
-
 4
4 -
 5
5 -
 6
6 -
 7
7 -
 8
8 -
 9
9 -
 10
10 -
 11
11 -
 12
12 -
 13
13 -
 14
14 -
 15
15 -
 16
16 -
 17
17 -
 18
18 -
 19
19 -
 20
20 -
 21
21 -
 22
22 -
 23
23 -
 24
24
 |
 |
Abercrombie &Fitch
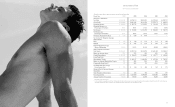
CONSOLIDATED BALANCE SHEETS
(Thousands, except share amounts) February 3, 2007 January 28, 2006
Assets
Current Assets
Cash and Equivalents $ 81,959 $ 50,687
Marketable Securities 447,793 411,167
Receivables 43,240 41,855
Inventories 427,447 362,536
Deferred Income Taxes 33,170 29,654
Other Current Assets 58,469 51,185
Total Current Assets 1,092,078 947,084
Property and Equipment, Net 1,092,282 813,603
Other Assets 63,707 29,031
Total Assets $ 2,248,067 $1,789,718
Liabilities and Shareholders’ Equity
Current Liabilities
Accounts Payable $0 100,919 $ 86,572
Outstanding Checks 27,391 58,741
Accrued Expenses 260,219 215,034
Deferred Lease Credits 35,423 31,727
Income Taxes Payable 86,675 99,480
Total Current Liabilities 510,627 491,554
Long-Term Liabilities
Deferred Income Taxes 0 30,394 38,496
Deferred Lease Credits 203,943 191,225
Commitments – –
Other Liabilities 97,806 73,326
Total Long-Term Liabilities 332,143 303,047
Shareholders’ Equity
Class A Common Stock – $0.01 par value: 150,000,000 shares
authorized and 103,300,000 shares issued at February 3, 2007
and January 28, 2006, respectively 0 1,033 1,033
Paid-In Capital 289,732 229,261
Retained Earnings 1,646,290 1,290,208
Accumulated Other Comprehensive Income (994) (796)
Deferred Compensation – 26,206
Treasury Stock, at Average Cost
14,999,945 and 15,573,789 shares at February 3, 2007
and January 28, 2006, respectively (530,764) (550,795)
Total Shareholders’ Equity
1,405,297 995,117
Total Liabilities and Shareholders’ Equity
$
2,248,067
$
1,789,718
The accompanying Notes are an integral part of these Consolidated Financial Statements.
27
$2,785
Abercrombie &Fitch
26
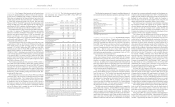
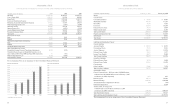
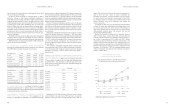
CONSOLIDATED STATEMENTS OF NET INCOME AND COMPREHENSIVE INCOME
2006* 2005 2004
$3,318,158 $2,784,711 $2,021,253
1,109,152 933,295 680,029
2,209,006 1,851,416 1,341,224
1,187,071 1,000,755 738,244
373,828 313,457 259,835
(9,983) (5,534) (4,490)
658,090 542,738 347,635
(13,896) (6,674) (5,218)
671,986 549,412 352,853
249,800 215,426 136,477
$422,186 $333,986 $216,376
$4.79 $3.83 $2.33
$4.59 $3.66 $2.28
88,052 87,161 92,777
92,010 91,221 95,110
$0.70 $0.60 $0.50
$(239) $(78) –
41 (718) –
$(198) $(796) –
$421,988 $333,190 $216,376
(Thousands, except per share amounts)
Net Sales
Cost of Goods Sold
Gross Profit
Stores and Distribution Expense
Marketing, General & Administrative Expense
Other Operating Income, Net
Operating Income
Interest Income, Net
Income Before Income Taxes
Provision for Income Taxes
Net Income
Net Income Per Share:
Basic
Diluted
Weighted-Average Shares Outstanding:
Basic
Diluted
Dividends Declared Per Share
Other Comprehensive Income
Cumulative Foreign Currency Translation Adjustments
Unrealized Gains (Losses) on Marketable Securities, net of
taxes of $20 and $0 for Fiscal 2006 and Fiscal 2005, respectively
Other Comprehensive Loss
Comprehensive Income
The accompanying Notes are an integral part of these Consolidated Financial Statements.
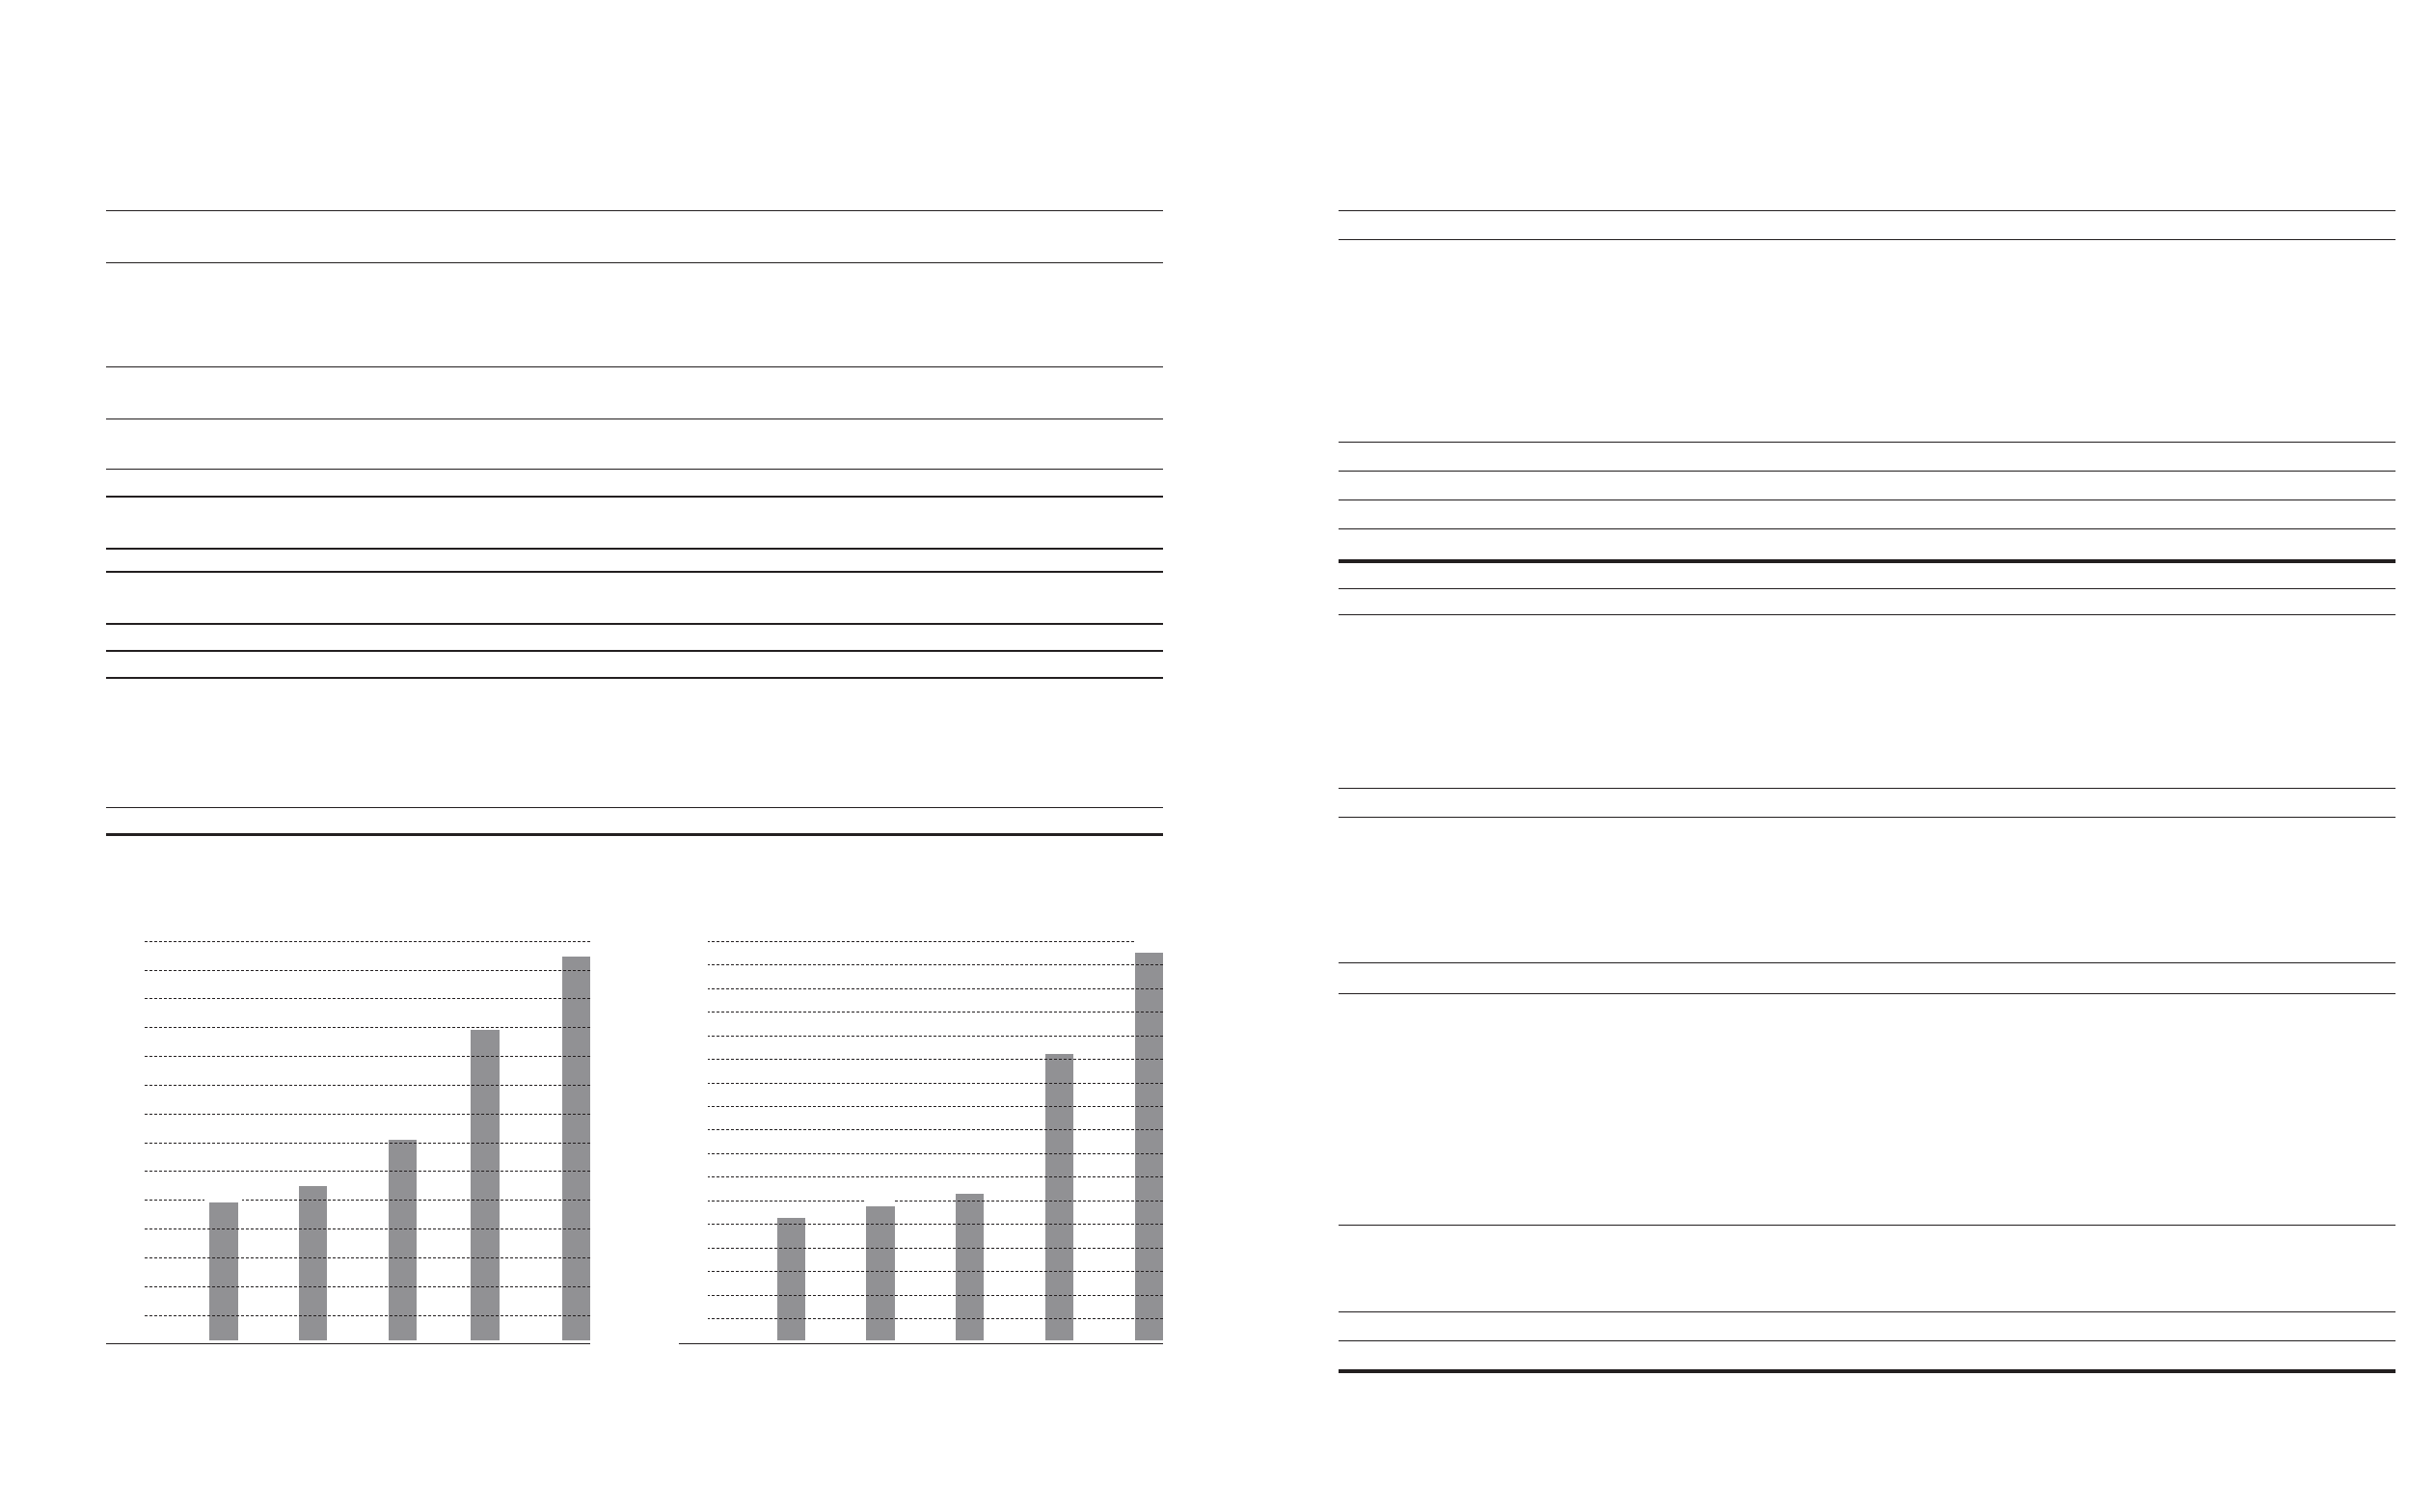
2002 2003 2004 2005 2006*
$ 800
$1,000
$1,200
$1,400
$1,600
$1,800
$2,000
$2,400
$2,600
$2,800
$1,596
$2,021
$3,000
$3,200
$3,400
Net Sales ($ in Millions)
Net Income ($ in Millions)
2002 2003 2004 2005 2006*
$110
$130
$150
$170
$190
$210
$230
$250
$270
$290
$310
$330
$350
$370
$390
$410
$430
$195
$205
$216
$333
$422
$2,200
$1,708
$3,318
* Fiscal 2006 is a fifty-three week year.