Abercrombie & Fitch 2006 Annual Report Download - page 10
Download and view the complete annual report
Please find page 10 of the 2006 Abercrombie & Fitch annual report below. You can navigate through the pages in the report by either clicking on the pages listed below, or by using the keyword search tool below to find specific information within the annual report.-
 1
1 -
 2
2 -
 3
3 -
 4
4 -
 5
5 -
 6
6 -
 7
7 -
 8
8 -
 9
9 -
 10
10 -
 11
11 -
 12
12 -
 13
13 -
 14
14 -
 15
15 -
 16
16 -
 17
17 -
 18
18 -
 19
19 -
 20
20 -
 21
21 -
22
-
23
-
24
 |
 |

per quarter. The Board of Directors will review the Company’s cash
position and results of operations and address the appropriateness of
future dividend amounts.
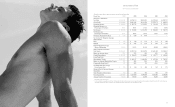
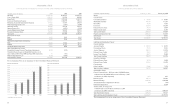
A summary of the Company’s working capital (current assets less
current liabilities) position and capitalization for the last three fiscal
years follows (thousands):
2006 2005 2004
Working capital $581,451 $455,530 $241,572
Capitalization:
Shareholders’ equity $1,405,297 $995,117 $669,326
The increase in working capital during Fiscal 2006 versus Fiscal 2005
was the result of higher cash and marketable securities, resulting prima-
rily from the Company’s net income increase and decreases in income taxes
payable, partially offset by an increase in accrued expenses. The increase
in working capital in Fiscal 2005 versus Fiscal 2004 was the result of
higher cash and marketable securities, resulting primarily from the
Company’s net sales increase, and the increase in inventory, partially
offset by an increase in income taxes payable.
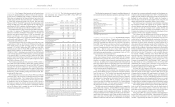
The Company considers the following to be measures of its liquidity
and capital resources for the last three fiscal years:
2006 2005 2004
Current ratio
(current assets divided by current liabilities) 2.14 1.93 1.56
Net cash provided by
operating activities (in thousands) $582,171* $453,590 $423,784
*Fiscal 2006 is a fifty-three week year.
OPERATING ACTIVITIES Net cash provided by operating activ-
ities, the Company’s primary source of liquidity, increased to $582.2
million for Fiscal 2006 from $453.6 million in Fiscal 2005. Cash in
Fiscal 2006 was provided primarily by current year net income, adjust-
ed for depreciation and amortization, share-based compensation
charges and lessor construction allowances collected. Uses of cash in
Fiscal 2006 consisted primarily of increases in inventory and payment
of income taxes. Cash in Fiscal 2005 was provided primarily by net
income adjusted for depreciation and amortization, share-based com-
pensation charges, lessor construction allowances collected and
decreases in payments of income taxes. Uses of cash in Fiscal 2005 con-
sisted primarily of increases in inventory.
Net cash provided by operating activities increased to $453.6 mil-
lion for Fiscal 2005 from $423.8 million in Fiscal 2004. Cash in Fiscal
2004 was provided primarily by net income adjusted for depreciation
and amortization, share-based compensation charges and lessor con-
struction allowances collected and increases in accounts payable and
accrued expenses. Uses of cash in Fiscal 2004 consisted primarily of
increases in inventory and other assets and liabilities.
The Company’s operations are seasonal and typically peak during
the Back-to-School and Holiday selling periods. Accordingly, cash
requirements for inventory expenditures are highest in the second and
third fiscal quarters as the Company builds inventory in anticipation of
these selling periods.
INVESTING ACTIVITIES Cash outflows for Fiscal 2006 were pri-
marily for purchases of marketable securities, purchase of trust owned life
insurance policies and capital expenditures. As of February 3, 2007 and
January 28, 2006, the Company held $466.1 million and $411.2 million,
respectively, of available-for-sale securities with original maturities of
greater than 90 days. Of the $466.1 million of available-for-sale securities
held as of February 3, 2007, $447.8 million were classified as marketable
securities while $18.3 million were held in an irrevocable rabbi trust (the
“Rabbi Trust”) and were classified as other assets.
Cash outflows for Fiscal 2005 were primarily for purchases of mar-
ketable securities and capital expenditures. As of January 28, 2006, the
Company held $411.2 million of available-for-sale securities with origi-
nal maturities of greater than 90 days classified as marketable securities.
Cash inflows for Fiscal 2004 were primarily the result of proceeds from
sales of marketable securities, offset by capital expenditures. See “Capital
Expenditures and Lessor Construction Allowances” for additional infor-
mation. As of January 29, 2005, all investments had maturities of less
than 90 days and accordingly were classified as cash equivalents.
FINANCING ACTIVITIES Cash outflows related to financing
activities consisted primarily of the payment of dividends and a change
in outstanding checks in Fiscal 2006. Cash outflows related to financ-
ing activities consisted primarily of the repurchase of the Company’s
Class A Common Stock and the payment of dividends in Fiscal 2005
and Fiscal 2004. Cash inflows consisted of stock option exercises and
restricted stock issuances.
The Company did not repurchase shares in Fiscal 2006. The
Company repurchased approximately 1.8 million shares and approx-
imately 11.2 million shares of its Class A Common Stock pursuant
to previously authorized stock repurchase programs in Fiscal 2005
and Fiscal 2004, respectively. As of February 3, 2007, the Company
had approximately 5.7 million shares available to repurchase under
the 6.0 million shares authorized by the Board of Directors in
August 2005.
On December 15, 2004, the Company entered into an amended
and restated $250 million syndicated unsecured credit agreement (the
“Amended Credit Agreement”). The primary purposes of the
Amended Credit Agreement are for trade and stand-by letters of cred-
it and working capital. The Amended Credit Agreement has several
borrowing options, including an option where interest rates are based
on the agent bank’s “Alternate Base Rate,” and another using the
London Interbank Offered Rate. The facility fees payable under the
Amended Credit Agreement are based on the ratio of the Company’s
leveraged total debt plus 600% of forward minimum rent commit-
ments to consolidated earnings before interest, taxes, depreciation,
amortization and rent for the trailing four fiscal quarter periods. The
facility fees are projected to accrue at either 0.15% or 0.175% on the
committed amounts per annum. The Amended Credit Agreement
contains limitations on indebtedness, liens, sale-leaseback transac-
Abercrombie &FitchAbercrombie &Fitch
FISCAL 2005 RESULTS: NET SALES Net sales for Fiscal 2005
were $2.785 billion, an increase of 37.8% versus Fiscal 2004 net sales
of $2.021 billion. The net sales increase was attributable to an
increase in comparable store sales of 26% for the year, the net addi-
tion of 63 stores during Fiscal 2005, and a $13.9 million increase in
net sales (including shipping and handling revenue) for the direct-to-
consumer business.
For the fiscal year, comparable store sales by brand were as fol-
lows: Abercrombie & Fitch increased 18%; abercrombie increased 54%;
Hollister increased 29%. In addition, the women’s, girls’ and bettys’ busi-
nesses continued to be more significant than the mens, boys and dudes.
During Fiscal 2005, women, girls and bettys represented over 60% of
the net sales for each of their corresponding brands. abercrombie girls
achieved a mid-sixties increase, Hollister bettys achieved a low-thirties
increase and Abercrombie & Fitch women had a high-teens increase.
Direct-to-consumer merchandise net sales in Fiscal 2005 were $122.5
million, an increase of 10.8% versus Fiscal 2004 net sales of $110.6 mil-
lion. Shipping and handling revenue was $17.6 million in Fiscal 2005
including shipping and handling revenue, accounted for 5.0% of net sales
in Fiscal 2005 compared to 6.2% of net sales in Fiscal 2004. The decrease
in sales penetration during Fiscal 2005 was due to the implementation of
brand protection initiatives throughout the year that reduced the amount
of sale merchandise available on the web sites and limited the customer’s
ability to purchase large quantities of the same item.
GROSS PROFIT For Fiscal 2005, gross profit increased to $1.851
billion from $1.341 billion in Fiscal 2004. The gross profit rate for Fiscal
2005 was 66.5% versus 66.4% the previous year. The gross profit rate
increase of 10 basis points reflects higher initial markup and a reduction in
shrink, partially offset by a slightly higher markdown rate in Fiscal 2004.
STORES AND DISTRIBUTION EXPENSE Stores and distribution
expense for Fiscal 2005 was $1.001 billion compared to $738.2 million for
Fiscal 2004. For Fiscal 2005, the stores and distribution expense rate was
35.9% compared to 36.5% in the previous year.
The Company’s total store and distribution expense, as a percent of net
sales, during Fiscal 2005 decreased 60 basis points versus Fiscal 2004 as a
result of the Company’s ability to leverage fixed costs, due to significant
comparable store sales increases, partially offset by increased store payroll
and store management expense. The leveraging of fixed costs included
rent, utilities and other landlord expenses, depreciation and amortization
and repairs and maintenance expense.
The DC’s UPH rate for the year was 7% lower in Fiscal 2005 versus
Fiscal 2004. The UPH rate decrease resulted from increases in inven-
tory and changes in the way the Company flowed merchandise to its
stores. Merchandise was routed to the stores in a more gradual process
in order to avoid stockroom congestion at the stores. This resulted in
the DC approaching capacity levels, which in turn resulted in a lower
productivity rate due to increased inventory handling.
MARKETING, GENERAL AND ADMINISTRATIVE EXPENSE
Marketing, general and administrative expense during Fiscal 2005 was
$313.5 million compared to $259.8 million in Fiscal 2004. For Fiscal
2005, the marketing, general and administrative expense rate was 11.3%
compared to 12.9% in Fiscal 2004. The decrease in the marketing,
general and administrative expense rate was due to a non-recurring
charge of $40.9 million in Fiscal 2004 related to a legal settlement and
leverage in the home office payroll expense, offset by a non-recurring
charge of $13.5 million related to a severance agreement of an executive
officer and legal costs.
OTHER OPERATING INCOME, NET Other operating income
for Fiscal 2005 was $5.5 million compared to $4.5 million for Fiscal
2004. The increase in other operating income was related to the favor-
able settlement of a class action lawsuit related to credit card fees in
which the Company was a class member and lease buyout payments
from landlords, partially offset by a lower amount of gift card liability
recognized as other income for gift cards for which the Company has
determined the likelihood of redemption to be remote.
OPERATING INCOME Fiscal 2005 operating income was $542.7
million compared to $347.6 million for Fiscal 2004, an increase of
56.1%. The operating income rate for Fiscal 2005 was 19.5% versus
17.2% in the previous year.
INTEREST INCOME, NET AND INCOME TAXES Net interest
income for Fiscal 2005 was $6.7 million compared to $5.2 million for
the previous year. The increase in net interest income was due to the
Company receiving higher rates on its investments, partially offset by
lower average investment balances during Fiscal 2005 when compared
to Fiscal 2004. The effective tax rate for Fiscal 2005 was 39.2% compared
to 38.7% for Fiscal 2004. The increase in the annual effective tax rate
was due to the Company’s change of estimates in the potential outcomes
of certain state tax matters in Fiscal 2005.
NET INCOME AND NET INCOME PER SHARE Net income for
Fiscal 2005 was $334.0 million versus $216.4 million in Fiscal 2004, an
increase of 54.3%. Net income included after-tax non-recurring charges of
$8.2 million in Fiscal 2005 related to a severance agreement of an executive
officer and $25.6 million in Fiscal 2004 related to a legal settlement. Net
income per diluted weighted-average share was $3.66 in Fiscal 2005 versus
$2.28 in Fiscal 2004, an increase of 60.5%. The percentage increase in net
income per diluted share outstanding was greater than the percentage
increase in net income due to the impact of the Company’s share repurchase
program. In Fiscal 2005, the Company repurchased 1.8 million shares.
FINANCIAL CONDITION Continued growth in net income result-
ed in higher cash provided by operating activities. A more detailed dis-
cussion of liquidity, capital resources and capital requirements follows.
LIQUIDITY AND CAPITAL RESOURCES The Company
believes cash provided by operating activities and cash on hand will
continue to provide adequate resources to support operations, including
projected growth, seasonal requirements and capital expenditures.
Furthermore, the Company expects that cash from operating activities
will fund dividends currently being paid at a rate of $0.175 per share
18 19