Abercrombie & Fitch 2006 Annual Report Download - page 6
Download and view the complete annual report
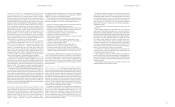
Please find page 6 of the 2006 Abercrombie & Fitch annual report below. You can navigate through the pages in the report by either clicking on the pages listed below, or by using the keyword search tool below to find specific information within the annual report.-
 1
1 -
 2
2 -
 3
3 -
 4
4 -
 5
5 -
 6
6 -
 7
7 -
 8
8 -
 9
9 -
 10
10 -
 11
11 -
 12
12 -
 13
13 -
 14
14 -
 15
15 -
 16
16 -
 17
17 -
18
-
19
-
20
-
21
-
22
-
23
-
24
 |
 |
Abercrombie &Fitch
11
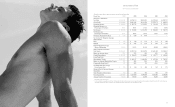
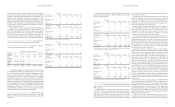
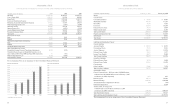
FINANCIAL SUMMARY
(Thousands, except per share, per square foot amounts, ratios and store and associate data)
Fiscal Year 2006* 2005 2004 2003 2002
Summary of Operations
Net Sales $3,318,158 $2,784,711 $2,021,253 $1,707,810 $1,595,757
Gross Profit $2,209,006 $1,851,416 $1,341,224
$1,083,170
$ 980,555
Operating Income $ 658,090 $ 542,738 $ 347,635 $ 331,180 $ 312,315
Operating Income as a
Percentage of Net Sales 19.8% 19.5% 17.2% 19.4% 19.6%
Net Income $ 422,186 $ 333,986 $ 216,376 $ 204,830 $ 194,754
Net Income as a
Percentage of Net Sales 12.7% 12.0% 10.7% 12.0% 12.2%
Dividends Declared Per Share $ 0.70 $ 0.60
$ 0.50
––
Net Income Per Weighted-Average
Share Results
Basic $ 4.79 $000 3.83 $000 2.33 $00 0 2.12 $00 0 1.98
Diluted $ 4.59 $0000 3.66 $00 02.28 $00 0 2.06 $00 0 1.94
Diluted Weighted-Average
Shares Outstanding 92,010 91,221$ 95,1100 99,580 100,631
Other Financial Information
Total Assets $2,248,067 $1,789,718 $1,386,791 $1,401,369 $1,190,615
Return on Average Assets 21% 21% 16% 16% 18%
Capital Expenditures $ 403,476 $ 256,422 $0 185,065 $ 0159,777 $ 145,662
Long-Term Debt – ––––
Shareholders’ Equity
$1,405,297
$ 995,117 $ 669,326 $ 857,764 $ 736,307
Return on Average Shareholders’ Equity 35% 40% 28% 26% 30%
Comparable Store Sales** 2% 26% 2% (9)% (5)%
Net Retail Sales Per Average
Gross Square Foot $ 500 $ 00 0464 $000 ,360 $ 345 $ 379
Stores at End of Year and Average
Associates
Total Number of Stores Open 944 851 788 700 597
Gross Square Feet 6,693,000 6,025,000 5,590,000 5,016,000 4,358,000
Average Number of Associates 80,100 69,100 48,500 30,200 22,000
* Fiscal 2006 is a fifty-three week year.
** A store is included in comparable store sales when it has been open as the same brand at least one year and its square footage has not been expanded or reduced by more than 20% within the past year.
Fiscal 2006 comparable store sales are compared to the comparable store sales for the fifty-three weeks ended February 4, 2006.