Abercrombie & Fitch 2006 Annual Report Download - page 7
Download and view the complete annual report
Please find page 7 of the 2006 Abercrombie & Fitch annual report below. You can navigate through the pages in the report by either clicking on the pages listed below, or by using the keyword search tool below to find specific information within the annual report.-
 1
1 -
 2
2 -
 3
3 -
 4
4 -
 5
5 -
 6
6 -
 7
7 -
 8
8 -
 9
9 -
 10
10 -
 11
11 -
 12
12 -
 13
13 -
 14
14 -
 15
15 -
 16
16 -
 17
17 -
 18
18 -
19
-
20
-
21
-
22
-
23
-
24
 |
 |
Abercrombie &Fitch
OVERVIEW The Company’s fiscal year ends on the Saturday closest
to January 31, typically resulting in a fifty-two week year, but occasional-
ly giving rise to an additional week, resulting in a fifty-three week year.
Fiscal years are designated in the financial statements and notes by the
calendar year in which the fiscal year commences. All references herein
to “Fiscal 2006” represent the results of the 53-week fiscal year ended
February 3, 2007; to “Fiscal 2005” represent the 52-week fiscal year ended
January 28, 2006; and to “Fiscal 2004” represent the 52-week fiscal year
ended January 29, 2005. In addition, all references herein to “Fiscal 2007”
represent the 52-week fiscal year that will end on February 2, 2008.
Fiscal 2006 includes fifty-three weeks and Fiscal 2005 includes fifty-
two weeks. For purposes of “Management’s Discussion and Analysis
of Financial Condition and Results of Operations”, the fourteen and
fifty-three week periods ended February 3, 2007 are compared to the
thirteen and fifty-two week periods ended January 28, 2006.
Comparable store sales however, compare the fourteen and fifty-three
week periods ended February 3, 2007 to the fourteen and fifty-three
week periods ended February 4, 2006.
The Company had net sales of $3.318 billion for the fifty-three weeks
ended February 3, 2007, up 19.1% from $2.785 billion for the fifty-two
weeks ended January 28, 2006. Operating income for Fiscal 2006
increased 21.3% to $658.1 million from $542.7 million for Fiscal 2005.
Operating income results for Fiscal 2006 included $14.1 million of
expense related to SFAS No. 123 (Revised 2004), “Share-Based Payment”
(“SFAS No. 123(R)”). Operating income results for Fiscal 2005 included
a non-recurring charge of $13.5 million related to a severance agreement
of an executive officer. Net income was $422.2 million in Fiscal 2006,
up 26.4% from $334.0 million in Fiscal 2005. Net income per diluted
weighted-average share was $4.59 for Fiscal 2006 compared to $3.66 in
Fiscal 2005, an increase of 25.4%.
The Company generated cash from operations of $582.2 million in
Fiscal 2006 versus $453.6 million in Fiscal 2005, resulting primarily
from strong sales and income growth. During Fiscal 2006, the Company
used cash from operations to finance its growth strategy, opening 70
new Hollister stores, 19 new abercrombie stores, eight new Abercrombie
& Fitch stores and seven new RUEHL stores, remodeling 13 Abercrombie
& Fitch stores, as well as refreshing existing Abercrombie & Fitch, aber-
crombie and Hollister stores.
The Company also used excess cash in Fiscal 2006 to pay dividends
of $0.70 per share, a 16.7% increase over $0.60 per share in Fiscal 2005,
for a total of $61.6 million. The Company believes that share repur-
chases and dividends are an important way for the Company to deliv-
er shareholder value, but the Company’s priority will be to invest in
the business to support its domestic and international growth plans.
The Company continues to be committed to maintaining sufficient
cash on the balance sheet to support the needs of the business and
withstand unanticipated business volatility.
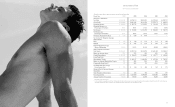
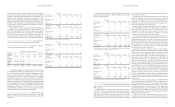
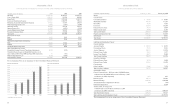
FINANCIAL SUMMARY The following summarized financial
and operational data compares Fiscal 2006 to Fiscal 2005 and
Fiscal 2005 to Fiscal 2004:
% Change
2006- 2005-
2006* 2005 2004 2005 2004
Net sales (thousands) $3,318,158 $2,784,711 $2,021,253 19% 38%
Net sales by brand (thousands)
Abercrombie & Fitch $1,515,123 $1,424,013 $1,210,222 6% 18%
abercrombie $ 405,820 $ 344,938 $ 227,204 18% 52%
Hollister $1,363,233 $ 999,212 $ 579,687 36% 72%
RUEHL** $ 33,982 $ 16,548 $ 4,140 105% nm
Increase (decrease) in
comparable store sales*** 2% 26% 2%
Abercrombie & Fitch (4)% 18% (1)%
abercrombie 10% 54% 1%
Hollister 5% 29% 13%
RUEHL** 14% n /a n /a
Net retail sales increase attributable
to new and remodeled stores,
web sites and catalogue 17% 12% 16%
Net retail sales per
average store (thousands) $ 3,533 $ 3,284 $ 2,569 8% 28%
Abercrombie & Fitch $ 3,945 $ 3,784 $ 3,103 4% 22%
abercrombie $ 2,251 $ 1,957 $ 1,241 15% 58%
Hollister $ 3,732 $ 3,442 $ 2,740 8% 26%
RUEHL** $ 3,248 $ 2,903 $ 1,255 12% nm
Net retail sales per average
gross square foot $ 500 $ 464 $ 360 8% 29%
Abercrombie & Fitch $ 450 $ 432 $ 352 4% 23%
abercrombie $ 513 $ 446 $ 282 15% 58%
Hollister $ 568 $ 528 $ 423 8% 25%
RUEHL** $ 363 $ 315 $ 136 15% nm
Transactions per average retail store 55,142 50,863 43,260 8% 18%
Abercrombie & Fitch 51,704 49,685 45,941 4% 8%
abercrombie 34,786 30,356 21,740 15% 40%
Hollister 68,740 64,913 56,687 6% 15%
RUEHL** 38,554 26,215 12,913 47% nm
Average retail transaction value $ 64.07 $ 64.56 $ 59.38 (1)% 9%
Abercrombie & Fitch $ 76.30 $ 76.16 $ 67.54 nm 13%
abercrombie $ 64.72 $ 64.47 $ 57.10 nm 13%
Hollister $ 54.30 $ 53.03 $ 48.33 2% 10%
RUEHL** $ 84.24 $ 110.74 $ 97.16 (24)% 14%
Average units per retail transaction 2.35 2.25 2.26 4% nm
Abercrombie & Fitch 2.26 2.18 2.22 4% (2)%
abercrombie 2.78 2.66 2.68 5% (1)%
Hollister 2.32 2.21 2.18 5% 1%
RUEHL** 2.57 2.28 2.17 13% 5%
Average unit retail sold $ 27.26 $ 28.69 $ 26.27 (5)% 9%
Abercrombie & Fitch $ 33.76 $ 34.94 $ 30.42 (3)% 15%
abercrombie $ 23.28 $ 24.24 $ 21.31 (4)% 14%
Hollister $ 23.41 $ 24.00 $ 22.17 (2)% 8%
RUEHL** $ 32.78 $ 48.57 $ 44.77 (33)% 8%
*Fiscal 2006 is a fifty-three week year.
**Net sales for RUEHL during Fiscal 2006, Fiscal 2005 and Fiscal 2004, and the related statistics,
reflect the activity of 14 stores open in Fiscal 2006, eight stores open in Fiscal 2005, and four stores
open in Fiscal 2004. As a result, year-to-year comparisons may not be meaningful.
***A store is included in comparable store sales when it has been open as the same brand at least one
year and its square footage has not been expanded or reduced by more than 20% within the past year.
Fiscal 2006 comparable store sales are compared to the comparable store sales for the fifty-three
weeks ended February 4, 2006.
also opened an on-campus merchandise research and development cen-
ter known as the Innovation Design Center (“IDC”). The IDC produces
graphic and wash samples for quick approval, and the final designs are
packaged for vendor production. The IDC enables the Company to
reduce the time to market for the latest fashion trends, saving time and
expense while limiting the competition’s ability to copy its designs.
The fourth major area of investment was information technology.
The Company invested in the upgrade of core systems to help run
allocation, planning, sourcing and merchandising. The system upgrades
are expected to make the Company more scalable, efficient and
accurate in the production and delivery of merchandise to stores. The
Company also continues to invest in best practice technologies that are
expected to provide a clear competitive advantage.
The Company views the Hollister brand as having a growing iconic
status and as a significant growth vehicle in the future. Hollister’s
success in Canada and the growth in international web sales have
resulted in the Company investigating the acceleration of its interna-
tional store rollout. Abercrombie & Fitch is a maturing brand with an
opportunity for future growth dependent on prime locations for its
stores along with brand expansion outside of the United States. The
Company is pursuing real estate in both Tokyo and key European
markets for the next phase of international expansion for Abercrombie
& Fitch and Hollister stores. abercrombie is viewed as having growth
opportunities within the United States, and the Company expects to
grow the brand to about 250 locations, as well as possible expansion
into Canada. RUEHL performed well in Fiscal 2006 with strong
trends in many areas. Transactions per store increased and the brand
achieved a 14% increase in comparable store sales, which the Company
believes indicates RUEHL is building a strong customer base. The
Company is targeting RUEHL Initial Markup (“IMU”) parity with
the other brands as well as profitability by the end of Fiscal 2007.
Additionally, the Company plans to introduce its next concept with
the opening of approximately three stores in January 2008 and approx-
imately four additional stores by March 2008.
For Fiscal 2007, the Company will be faced with the challenge of
improving on Fiscal 2006’s performance. From a gross margin standpoint,
while the Company has been able to improve its IMU in the past, the
Company does not anticipate IMU improvements in its forecasts. The
Company expects to leverage marketing, general and administrative
expense in Fiscal 2007. However, with additional expenses such as store
minimum wage increases, store manager payroll increases, new concept
pre-opening costs and incremental costs of operating the second DC, the
Company does not anticipate leveraging stores and distribution expense
on a flat to slightly positive comparable store sales increase in Fiscal 2007.
The Company ended the fourth quarter of Fiscal 2006 with inven-
tories, at cost, up 6% per gross square foot versus the fourth quarter of
Fiscal 2005. The Company believes it will end the first quarter of
Fiscal 2007 with inventory flat to slightly positive on a per gross square
foot, at cost, when compared to the first quarter of Fiscal 2006.
During Fiscal 2007, the Company anticipates capital expenditures
between $395 million and $405 million. Approximately $220 million
of this amount is allocated to new store construction and full store
remodels. Approximately $60 million is expected to be allocated to
Abercrombie &Fitch
12 13
MANAGEMENT’S DISCUSSION AND ANALYSIS OF FINANCIAL CONDITION AND RESULTS OF OPERATIONS
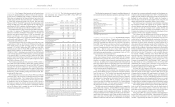
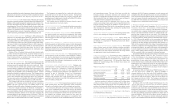
The following data represents the Company’s consolidated statements of
net income for the last three fiscal years, expressed as a percentage of net sales:
2006* 2005 2004
Net Sales 100.0% 100.0% 100.0%
Cost of Goods Sold 33.4 33.5 33.6
Gross Profit 66.6 66.5 66.4
Stores and Distribution Expense 35.8 35.9 36.5
Marketing, General and Administrative Expense 11.3 11.3 12.9
Other Operating Income, Net (0.3) (0.2) (0.2)
Operating Income 19.8 19.5 17.2
Interest Income, Net (0.4) (0.2) (0.3)
Income Before Income Taxes 20.3 19.7 17.5
Provision for Income Taxes 7.5 7.7 6.8
Net Income 12.7% 12.0% 10.7%
*Fiscal 2006 is a fifty-three week year.
CURRENT TRENDS AND OUTLOOK In Fiscal 2006, the Company
continued to grow the business. Despite performance that was very
challenging to build on in Fiscal 2005, the Company achieved a 2%
increase in comparable store sales and a 19.1% increase in net sales in
Fiscal 2006. The increase in net sales was driven by a combination of
new store growth, an increase in the direct-to-consumer business,
increases in transactions per store and a fifty-three week year in Fiscal
2006 versus a fifty-two week year in Fiscal 2005. Overall, the
Company was able to make significant investments in future growth
while improving operating income, as a percentage of sales, to 19.8%.
These investments are summarized below.
The first major area of investment was strengthening the iconic
nature of the Company’s brands. During Fiscal 2006, the Company
eliminated distinct seasonal sales events to ensure that full price mer-
chandise was available at stores during the transition from one season
to the next. In addition, the Company refreshed select Abercrombie &
Fitch stores with the objective of replicating certain aspects of the Fifth
Avenue Flagship store experience. Finally, the Company increased salary
levels in several store manager categories in an effort to continue attract-
ing and retaining strong management teams.
The second major area of investment was international growth.
During Fiscal 2006 the Company expanded its Canadian operations
from two stores to six. The Canadian stores generated approximately
three times the sales per square foot of an average U.S. store. As a
result of the success of the Canadian stores, the Company is exploring
the opportunity of expanding the abercrombie brand into Canada in
Fiscal 2007. During Fiscal 2006 the Company also invested its
resources and focus on building and staffing its U.K. London flagship
Abercrombie & Fitch store. The store opened on March 22, 2007 and
the initial results exceeded the Company’s expectations.
The third major area of investment was infrastructure to support the
future growth of the Company. In Fiscal 2006, the Company opened its
second distribution center (“DC”) which increased the Company’s
capacity to support stores by approximately 800 stores. In addition, the
Company continued to invest in staffing on both the creative and admin-
istrative sides of the business in order to offset the effect of under-invest-
ment in prior years. For Fiscal 2007, the Company does not anticipate
additions to headcount at the same rate as in Fiscal 2006. The Company