AT&T Wireless 2007 Annual Report Download - page 30
Download and view the complete annual report
Please find page 30 of the 2007 AT&T Wireless annual report below. You can navigate through the pages in the report by either clicking on the pages listed below, or by using the keyword search tool below to find specific information within the annual report.-
 1
1 -
2
-
3
-
4
-
5
-
6
-
7
-
8
-
9
-
10
-
11
-
12
-
13
-
14
-
15
-
16
-
17
-
18
-
19
-
 20
20 -
 21
21 -
 22
22 -
 23
23 -
 24
24 -
 25
25 -
 26
26 -
 27
27 -
 28
28 -
 29
29 -
 30
30 -
 31
31 -
 32
32 -
 33
33 -
 34
34 -
 35
35 -
 36
36 -
 37
37 -
 38
38 -
 39
39 -
 40
40 -
41
-
42
-
43
-
44
-
45
-
46
-
47
-
48
-
49
-
50
-
51
-
52
-
53
-
54
-
55
-
56
-
57
-
58
-
59
-
60
-
61
-
62
-
63
-
64
-
65
-
66
-
67
-
68
-
69
-
70
-
71
-
72
-
73
-
74
-
75
-
76
-
77
-
78
-
79
-
80
-
81
-
82
-
83
-
84
-
85
-
86
-
87
-
88
 |
 |

28
| 2007 AT&T Annual Report
interest in AT&T Mobility under the equity method since we
shared control equally with BellSouth. AT&T Mobility is now
a wholly-owned subsidiary of AT&T, and wireless results
are reflected in operating revenues and expenses in our
consolidated statements of income.
Equity in net income of affiliates decreased $1,351 in
2007. The decrease in 2007 was a result of the change in
accounting for AT&T Mobility to a wholly-owned subsidiary,
partially offset by improved results from our investments in
América Móvil S.A. de C.V. (América Móvil) and Teléfonos
de México, S.A. de C.V. (Telmex). Equity in net income of
affiliates increased $1,434 in 2006. The increase in 2006
was primarily due to AT&T Mobility’s improved results, of
which $1,308 was our proportionate share.
Other income (expense) – net We had other income of
$615 in 2007, $393 in 2006 and $397 in 2005. Results for
2007 included gains of $409 related to a wireless spectrum
license exchange, $166 in interest income, $148 from the sale
of administrative buildings and other non-strategic assets and
$88 from other non-operating activities. These gains were
partially offset by $196 in minority interest expense.
Other income for 2006 included interest income of $377.
There were no individually significant other income or expense
transactions during 2006. Results for 2005 primarily included
interest income of $383, a gain of $108 on the sales of shares
of Amdocs Limited, American Tower Corp. (American Tower)
and Yahoo! Inc. and other miscellaneous gains. These gains
were partially offset by other 2005 expenses of $126 to
reflect an increase in value of a third-party minority holder’s
interest in an AT&T subsidiary’s preferred stock and other
miscellaneous expenses.
Income taxes increased $2,728, or 77.4%, in 2007 and
$2,593 in 2006. The increase in income taxes in 2007 was
primarily due to higher operating income in 2007 reflecting
the addition of BellSouth’s and its share of AT&T Mobility’s
operating results. Our effective tax rate in 2007 was 34.4%,
compared to 32.4% in 2006 and 16.3% in 2005. The increase
in our effective tax rate for 2007 was primarily due to the
consolidation of AT&T Mobility and an increase in income
before income taxes. Prior to the consolidation of AT&T
Mobility, our income before income taxes included our equity
in AT&T Mobility’s after-tax net income. With consolidation,
the AT&T Mobility income tax expense that was previously
netted in income before income taxes is now included in
our consolidated income tax expense.
The increase in income tax expense in 2006 compared to
2005 was primarily due to the higher income before income
taxes in 2006 and our agreement in December 2005 with
the Internal Revenue Service (IRS) to settle certain claims
principally related to the utilization of capital losses and tax
credits for tax years 1997 – 1999. The settlement reduced
income tax expense by $902 in 2005, which also lowered
our effective tax rate for 2005. (See Note 10)
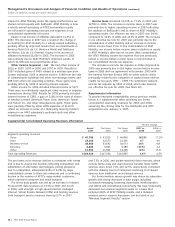
Supplemental Information
To provide improved comparability versus previous results,
below is a supplemental table providing pro forma
consolidated operating revenues for 2005 and 2006,
assuming the closing date for the BellSouth and ATTC
acquisitions was January 1, 2005.
Management’s Discussion and Analysis of Financial Condition and Results of Operations (continued)
Dollars in millions except per share amounts
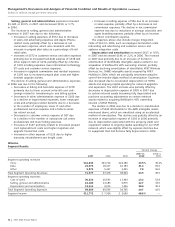
Supplemental Consolidated Operating Revenues Information
Percent Change
Actual Pro Forma Pro Forma 2007 vs. 2006 vs.
2007 2006 2005 2006 2005
Segment operating revenues
Voice $ 40,798 $ 43,505 $ 46,849 (6.2)% (7.1)%
Data 23,206 22,173 21,326 4.7 4.0
Wireless service 38,568 33,692 30,673 14.5 9.8
Directory 4,806 5,823 5,689 (17.5) 2.4
Other 11,550 11,861 12,268 (2.6) (3.3)
Total Operating Revenues $118,928 $117,054 $116,805 1.6% 0.2%
The pro forma voice revenue decline is consistent with trends
and is due to access line declines reflecting competition and
substitution of alternative technologies, pricing pressures
due to competition, anticipated shifts of traffic by major
consolidated carriers to their own networks and a continuing
decline in the number of ATTC’s mass-market customers,
which represent consumer and small business.
Pro forma data growth was led by an increase in Internet
Protocol (IP) data revenues of 13.3% in 2007 and 14.1%
in 2006, with strength in high-speed Internet, managed
Internet, Virtual Private Network (VPN) and hosting services.
Data transport service revenues were up 0.7% in 2007
and 3.3% in 2006, and packet-switched data revenues, which
include frame relay and asynchronous transfer mode (ATM)
services, were down 7.0% and 12.5%, respectively, consistent
with the industry trend of customers switching to IP-based
services from traditional circuit-based services.
Pro forma wireless service growth was driven by subscriber
growth and strong increases in data usage, including
increased messaging, browsing, downloads, media bundles
and laptop and smartphone connectivity. We have historically
discussed our wireless segment results on a basis that
included 100% of AT&T Mobility results, and a detailed
wireless service revenue discussion can be found in our
“Wireless Segment Results” section.