APS 2014 Annual Report Download - page 5
Download and view the complete annual report
Please find page 5 of the 2014 APS annual report below. You can navigate through the pages in the report by either clicking on the pages listed below, or by using the keyword search tool below to find specific information within the annual report.-
 1
1 -
 2
2 -
 3
3 -
 4
4 -
 5
5 -
 6
6 -
 7
7 -
 8
8 -
 9
9 -
 10
10 -
 11
11 -
 12
12 -
 13
13 -
 14
14 -
 15
15 -
 16
16 -
17
-
18
-
19
-
20
-
21
-
22
-
23
-
24
-
25
-
26
-
27
-
28
-
29
-
30
-
31
-
32
-
33
-
34
-
35
-
36
-
37
-
38
-
39
-
40
-
41
-
42
-
43
-
44
 |
 |

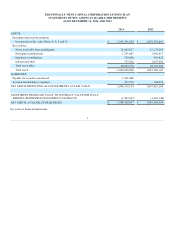
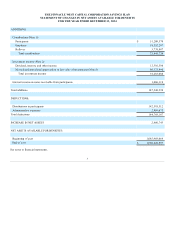
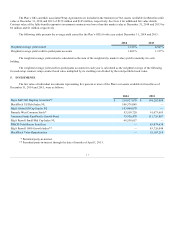
ADDITIONS:
Contributions (Note 1):
Participants $ 51,208,570
Employer 18,552,267
Rollover 3,738,887
Total contributions 73,499,724
Investment income (Note 2):
Dividend, interest, and other income 12,310,598
Net realized/unrealized appreciation in fair value of investments (Note 5) 60,372,490
Total investment income 72,683,088
Interest income on notes receivable from participants 1,066,118
Total additions 147,248,930
DEDUCTIONS:
Distributions to participants 142,318,512
Administrative expenses 2,469,675
Total deductions 144,788,187
INCREASE IN NET ASSETS 2,460,743
NET ASSETS AVAILABLE FOR BENEFITS:
Beginning of year 1,085,968,064
End of year $ 1,088,428,807
See notes to financial statements.
3