APS 2014 Annual Report Download - page 13
Download and view the complete annual report
Please find page 13 of the 2014 APS annual report below. You can navigate through the pages in the report by either clicking on the pages listed below, or by using the keyword search tool below to find specific information within the annual report.
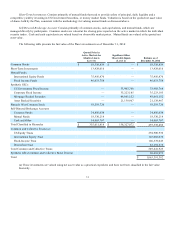
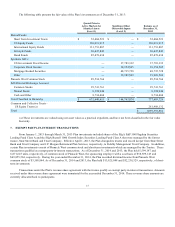
The Plan’s GICs and their associated Wrap Agreements are included in the Statement of Net Assets Available for Benefits at fair
value at December 31, 2014 and 2013 of $159 million and $145 million, respectively. See Note 6 for additional fair value details.
Contract value of the fully-benefit responsive investment contracts was lower than fair market value at December 31, 2014 and 2013 by
$2 million and $1 million, respectively.
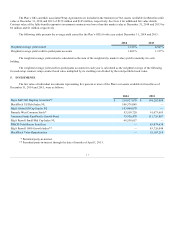
The following table presents the average yield earned by the Plan’s GICs for the year ended December 31, 2014 and 2013:
Weighted average yield earned
1.339%
0.947%
Weighted average yield credit to participants accounts
1.463%
1.127%
The weighted average yield earned is calculated as the sum of the weighted (by market value) yield to maturity for each
holding.
The weighted average yield credit to participants accounts for each year is calculated as the weighted average of the following
for each wrap contract: wrap contract book value multiplied by its crediting rate divided by the total portfolio book value.
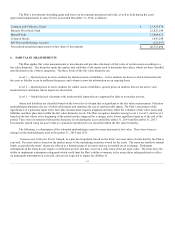
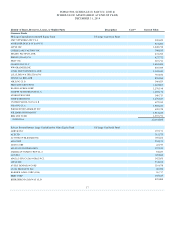
The fair value of individual investments representing five percent or more of the Plan’s net assets available for benefits as of
December 31, 2014 and 2013, were as follows:
SSgA S&P 500 Flagship Securities**
$ 210,927,070
$ 198,262,084
BlackRock US Debt Index NL
106,378,045
—
SSgA Global All Cap Equity NL
103,068,070
—
Pinnacle West Common Stock*
93,510,720
91,073,685
American Funds EuroPacific Growth Fund
75,956,470
131,753,807
SSgA Russell Small/Mid Cap Index NL
68,558,657
—
PIMCO Total Return Fund Inst.
—
85,478,634
SSgA Russell 1000 Growth Index**
—
83,726,048
BlackRock Value Opportunities
—
55,163,210
* Permitted party-in-interest.
** Permitted party-in-interest through the date of transfer of April 1, 2013.
11


