APS 2014 Annual Report Download - page 16
Download and view the complete annual report
Please find page 16 of the 2014 APS annual report below. You can navigate through the pages in the report by either clicking on the pages listed below, or by using the keyword search tool below to find specific information within the annual report.-
 1
1 -
2
-
3
-
4
-
5
-
 6
6 -
 7
7 -
 8
8 -
 9
9 -
 10
10 -
 11
11 -
 12
12 -
 13
13 -
 14
14 -
 15
15 -
 16
16 -
 17
17 -
 18
18 -
 19
19 -
 20
20 -
 21
21 -
 22
22 -
 23
23 -
 24
24 -
 25
25 -
 26
26 -
27
-
28
-
29
-
30
-
31
-
32
-
33
-
34
-
35
-
36
-
37
-
38
-
39
-
40
-
41
-
42
-
43
-
44
 |
 |
Consists primarily of mutual funds that seek to provide safety of principal, daily liquidity and a
competitive yield by investing in US Government Securities, or money market funds. Valuation is based on the quoted net asset value
of shares held by the Plan, consistent with the methodology for valuing mutual funds as discussed above.
Consists primarily of common stocks, cash equivalents, and mutual funds, which are
managed directly by participants. Common stocks are valued at the closing price reported on the active market in which the individual
security trades. Cash and cash equivalents are valued based on observable market prices. Mutual funds are valued at the quoted net
asset value.
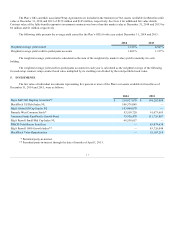
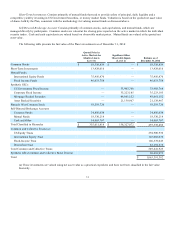
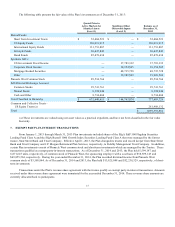
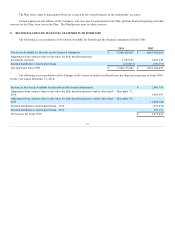
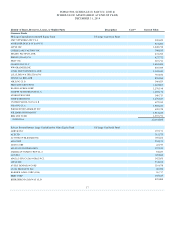
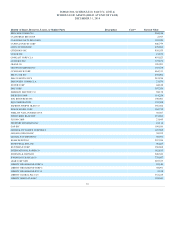
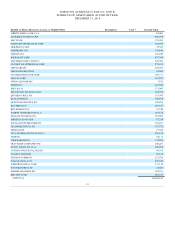
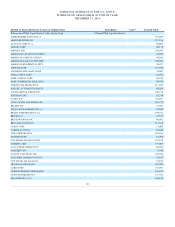
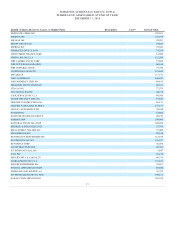
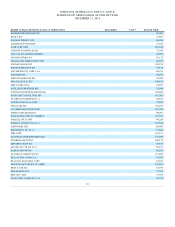
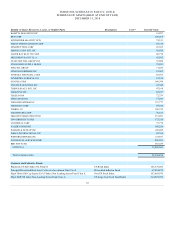
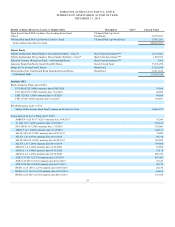
The following table presents the fair value of the Plan’s investments as of December 31, 2014:
Common Stocks
$ 58,330,839
$ —
$ 58,330,839
Short-Term Investments
13,929,016
—
13,929,016
Mutual Funds:
International Equity Funds
75,956,470
—
75,956,470
Fixed Income Funds
46,033,754
—
46,033,754
Synthetic GICs:
US Government Fixed Income
—
33,903,768
33,903,768
Corporate Fixed Income
—
35,223,185
35,223,185
Mortgage Backed Securities
—
48,061,152
48,061,152
Asset Backed Securities
—
21,138,967
21,138,967
Pinnacle West Common Stock
93,510,720
—
93,510,720
Self-Directed Brokerage Account:
Common Stocks
34,856,634
—
34,856,634
Mutual Funds
18,330,214
—
18,330,214
Cash and Other
14,063,767
—
14,063,767
Total Classified in Hierarchy
$ 355,011,414
$ 138,327,072
493,338,486
Common and Collective Trusts (a):
US Equity Trusts
294,900,930
International Equity Trust
103,068,070
Fixed-Income Trust
106,378,045
Diversified Trust
45,294,878
Total Common and Collective Trusts
549,641,923
Synthetic GICs Common and Collective Bond Trust (a)
20,410,973
Total
$ 1,063,391,382
(a) These investments are valued using net asset value as a practical expedient, and have not been classified in the fair value
hierarchy.
14