Whirlpool 2001 Annual Report Download - page 62
Download and view the complete annual report
Please find page 62 of the 2001 Whirlpool annual report below. You can navigate through the pages in the report by either clicking on the pages listed below, or by using the keyword search tool below to find specific information within the annual report.-
 1
1 -
2
-
3
-
4
-
5
-
6
-
7
-
8
-
9
-
10
-
11
-
12
-
13
-
14
-
15
-
16
-
17
-
18
-
19
-
20
-
21
-
22
-
23
-
24
-
25
-
26
-
27
-
28
-
29
-
30
-
31
-
32
-
33
-
34
-
35
-
36
-
37
-
38
-
39
-
40
-
41
-
42
-
43
-
44
-
45
-
46
-
47
-
48
-
49
-
50
-
51
-
 52
52 -
 53
53 -
 54
54 -
 55
55 -
 56
56 -
 57
57 -
 58
58 -
 59
59 -
 60
60 -
 61
61 -
 62
62 -
 63
63 -
 64
64 -
 65
65 -
 66
66 -
 67
67 -
 68
68
 |
 |

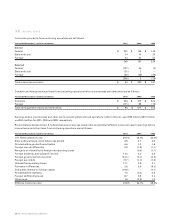
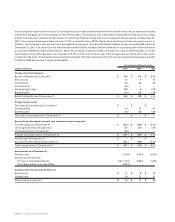
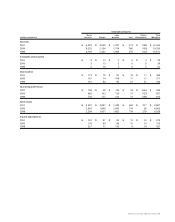
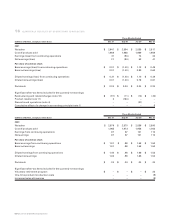
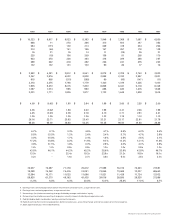
Eleven-Year Consolidated Statistical Review60
(millions of dollars except share and employee data) 2001 2000 1999
Consolidated operations
Net sales $ 10,343 $ 10,325 $ 10,511
Operating profit 1306 807 875
Earnings (loss) from continuing operations before income taxes and other items 93 577 514
Earnings (loss) from continuing operations 34 367 347
Earnings (loss) from discontinued operations 2(21) – –
Net earnings (loss) 321 367 347
Net capital expenditures 378 375 437
Depreciation 368 371 386
Dividends paid 113 70 103
Consolidated financial position
Current assets $ 3,311 $ 3,237 $ 3,177
Current liabilities 3,082 3,303 2,892
Current assets minus current liabilities 229 (66) 285
Property, plant and equipment-net 2,052 2,134 2,178
Total assets 6,967 6,902 6,826
Long-term debt 1,295 795 714
Stockholders’ equity 1,458 1,684 1,867
Per share data
Basic earnings (loss) from continuing operations
before accounting change $ 0.51 $ 5.24 $ 4.61
Diluted earnings (loss) from continuing operations
before accounting change 0.50 5.20 4.56
Diluted net earnings (loss) 30.31 5.20 4.56
Dividends 1.36 1.36 1.36
Book value 21.44 23.84 24.55
Closing Stock Price - NYSE 73.33 47.69 65.06
Key ratios 4
Operating profit margin 3.0% 7.8% 8.3%
Pre-tax margin 50.9% 5.6% 4.9%
Net margin 60.3% 3.6% 3.3%
Return on average stockholders’ equity 71.3% 20.7% 17.9%
Return on average total assets 80.4% 5.5% 4.2%
Current assets to current liabilities 1.1x 1.0x 1.1x
Total debt-appliance business as a percent of invested capital 948.0% 49.4% 37.7%
Price earnings ratio 236.5x 9.2x 14.3x
Interest coverage 10 1.6x 4.2x 4.1x
Other data
Number of common shares outstanding (in thousands):
Average – on a diluted basis 68,036 70,637 76,044
Year-end 67,215 66,265 74,463
Number of stockholders (year-end) 8,840 11,780 12,531
Number of employees (year-end) 59,408 60,695 61,066
Total return to shareholders (five year annualized) 11 12.2% 0.3% 7.9%
1. Restructuring and special operating charges were $212 million in 2001, $405 million in 1997, $30 million in 1996 and $250 million in 1994.
2. The Company’s financial services business was discontinued in 1997.
3. Includes cumulative effect of accounting changes: 2001 – Accounting for derivative instruments and hedging activities of $8 million or $0.12 per diluted share;
1993 – Accounting for postretirement benefits other than pensions of ($180) million or ($2.42) per diluted share.
4. Excluding one-time charges for restructuring and related charges, product recalls, discontinued operations and accounting changes in 2001, selected key ratios would be
as follows: a) Operating profit margin – 7.9%, b) Pre-tax margin – 5.8%, c) Net margin - 3.6%, d) Return on average stockholder's equity – 22.2%, e) Return on average total
assets – 5.6%, and f) Interest coverage – 5x. Excluding the first quarter impact of the Brazilian currency devaluation in 1999 and the gain from discontinued operations in
1998, returns on average stockholders’ equity were 19.9% and 16.5%, and returns on average total assets were 5.7% and 4.3%. Excluding non-recurring items, selected
1997 Key Ratios would be as follows: a) Operating profit margin – 4.7%, b) Pre-tax margin – 2.7%, c) Net margin – 2.6%, d) Return on average stockholders’ equity – 12%, e)
Return on average total assets – 2.7%, f) Interest coverage – 3.0x.
Eleven-Year Consolidated Statistical Review