Whirlpool 2001 Annual Report Download - page 33
Download and view the complete annual report
Please find page 33 of the 2001 Whirlpool annual report below. You can navigate through the pages in the report by either clicking on the pages listed below, or by using the keyword search tool below to find specific information within the annual report.-
 1
1 -
2
-
3
-
4
-
5
-
6
-
7
-
8
-
9
-
10
-
11
-
12
-
13
-
14
-
15
-
16
-
17
-
18
-
19
-
20
-
21
-
22
-
 23
23 -
 24
24 -
 25
25 -
 26
26 -
 27
27 -
 28
28 -
 29
29 -
 30
30 -
 31
31 -
 32
32 -
 33
33 -
 34
34 -
 35
35 -
 36
36 -
 37
37 -
 38
38 -
 39
39 -
 40
40 -
 41
41 -
 42
42 -
 43
43 -
44
-
45
-
46
-
47
-
48
-
49
-
50
-
51
-
52
-
53
-
54
-
55
-
56
-
57
-
58
-
59
-
60
-
61
-
62
-
63
-
64
-
65
-
66
-
67
-
68
 |
 |

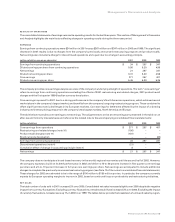
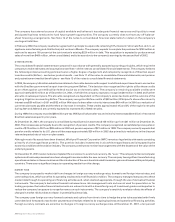
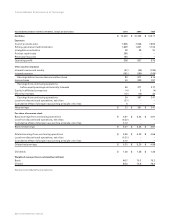
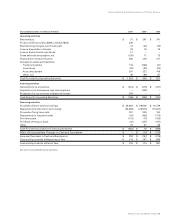
2001 Change 2000 Change 1999
Gross margin
North America 23.5% (0.8)pts 24.3% (1.1)pts 25.4%
Europe 21.3 (2.0) 23.3 (2.6) 25.9
Latin America 26.0 3.1 22.9 (0.2) 23.1
Asia 26.2 0.1 26.1 1.0 25.1
Consolidated, before restructuring related charges 23.9% (0.2)pts 24.1% (1.2)pts 25.3%
Restructuring related charges (0.5)% (0.5)pts –––
Consolidated 23.4% (0.7)pts 24.1% (1.2)pts 25.3%
Significant regional trends were as follows:
North American gross margin declined versus 2000 due to unfavorable product and channel mix, lower pension credits and
increased warranty costs offsetting productivity improvements. The decline in 2000 versus 1999 was due to industry-wide price
deterioration, unfavorable product and channel mix and increased engineering and product launch expenses. These factors
were partially offset by volume increases, ongoing productivity improvements and pension credits.
The European gross margin was down versus 2000 due to higher material costs, an inventory write-down and continued pricing
pressures. The margin did, however, improve throughout the year due to productivity gains and benefits from the restructuring
effort. In 2000, the gross margin decreased due to intensified price competition, rising material costs and slowing demand.
Latin American gross margin improved over 2000 as an improved product mix, a reduction in pension liabilities, productivity
gains and restructuring benefits offset material price increases and pricing pressures. The 2000 gross margin ended the year level
with 1999 as higher material costs were offset by sales tax credits.
The Asian gross margin remained strong in 2001 as productivity improvements and product mix offset pricing pressures due to
weakening economies included in this region.
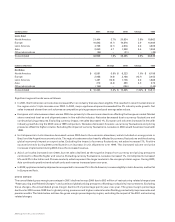
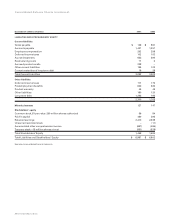
SELLING, GENERAL AND ADMINISTRATIVE
Consolidated selling, general and administrative expenses as a percent of net sales decreased versus 2000 as cost controls implemented
in North America and global restructuring benefits more than offset increased bad debt expense, increased stock compensation
costs, new product introduction costs, restructuring related charges and lower pension credits. Consolidated selling, general and
administrative expenses as a percent of net sales decreased in 2000 versus 1999 due primarily to pension credits in North America
and cost containment efforts in Europe and Brazil offsetting additional spending related to brand strategies. The table below outlines
the selling, general and administrative expenses as a percentage of sales by region, excluding the impact of the 2001 restructuring
related charges.
As aAs aAs a
Percentage Percentage Percentage
(millions of dollars) 2001 of Sales 2000 of Sales 1999 of Sales
Selling, general &
administrative expenses
North America $ 788 12.0% $ 825 13.3% $ 838 13.6%
Europe 386 18.8 386 17.9 443 18.1
Latin America 250 16.8 263 15.4 263 15.8
Asia 74 19.9 76 19.4 76 20.3
Corporate 132 –101 –133 –
Consolidated, before restructuring related charges $ 1,630 15.8% $ 1,651 16.0% $ 1,753 16.7%
Restructuring related charges 9 –––––
Consolidated $ 1,639 15.8% $ 1,651 16.0% $ 1,753 16.7%
Whirlpool Corporation 2001 Annual Report 31