Whirlpool 2001 Annual Report Download - page 31
Download and view the complete annual report
Please find page 31 of the 2001 Whirlpool annual report below. You can navigate through the pages in the report by either clicking on the pages listed below, or by using the keyword search tool below to find specific information within the annual report.-
 1
1 -
2
-
3
-
4
-
5
-
6
-
7
-
8
-
9
-
10
-
11
-
12
-
13
-
14
-
15
-
16
-
17
-
18
-
19
-
20
-
 21
21 -
 22
22 -
 23
23 -
 24
24 -
 25
25 -
 26
26 -
 27
27 -
 28
28 -
 29
29 -
 30
30 -
 31
31 -
 32
32 -
 33
33 -
 34
34 -
 35
35 -
 36
36 -
 37
37 -
 38
38 -
 39
39 -
 40
40 -
 41
41 -
42
-
43
-
44
-
45
-
46
-
47
-
48
-
49
-
50
-
51
-
52
-
53
-
54
-
55
-
56
-
57
-
58
-
59
-
60
-
61
-
62
-
63
-
64
-
65
-
66
-
67
-
68
 |
 |

Whirlpool Corporation 2001 Annual Report 29
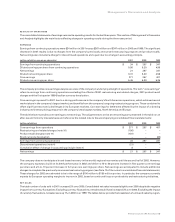
RESULTS OF OPERATIONS
The consolidated statements of earnings summarize operating results for the last three years. This section of Management’s Discussion
and Analysis highlights the main factors affecting changes in operating results during the three-year period.
EARNINGS
Earnings from continuing operations were $34 million in 2001 versus $367 million and $347 million in 2000 and 1999. The significant
decrease in 2001 results is due to charges from the company’s previously announced restructuring program and product recalls.
Net earnings also included a charge for discontinued operations and a gain due to a change in accounting principle.
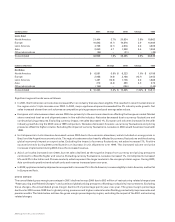
(millions of dollars, except per share data) 2001 2000 1999
Earnings from continuing operations $ 34 $ 367 $ 347
Diluted earnings per share from continuing operations 0.50 5.20 4.56
Net earnings 21 367 347
Diluted net earnings per share 0.31 5.20 4.56
Core earnings 371 367 407
Diluted core earnings per share 5.45 5.20 5.35
The company provides core earnings analysis as a view of the company’s underlying strength of operations. The term “core earnings”
refers to earnings from continuing operations excluding the effects of 2001 restructuring and related charges, 2001 product recall
charges and the first quarter 1999 Brazilian currency devaluation.
Core earnings improved for 2001 due to a strong performance in the company’s North American operations, which achieved record
market share in the company’s largest market, and benefits from the company’s ongoing restructuring program. These combined to
offset significant economic challenges in its European markets. Core earnings for 2000 were affected by the impact of a slowing
industry and intense pricing pressures in the company’s two largest markets, North America and Europe.
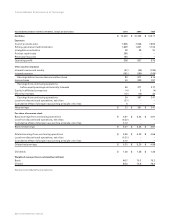
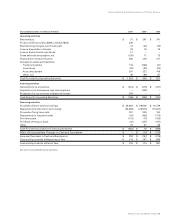
The table below reconciles core earnings to net earnings. The adjustments to arrive at net earnings are presented in the table on an
after-tax and minority interests basis and reference the related note to the accompanying consolidated financial statements:
(millions of dollars) 2001 2000 1999
Core earnings from operations $ 371 $ 367 $ 407
Restructuring and related charges (note 10) (156) ––
Product recall charges (note 11) (181) ––
Brazil currency devaluation ––(60)
Earnings from continuing operations 34 367 347
Discontinued operations (note 4) (21) ––
Cumulative effect of change in accounting principle (note 1) 8 ––
Net earnings $ 21 $ 367 $ 347
The company does not anticipate a broad-based recovery in the world’s regional economies until the second half of 2002. However,
the company expects to build on its 2001 performance in 2002 and deliver a15-to-20 percent increase in first quarter core earnings
per share and a 5-to-10 percent increase in full year core earnings per share. Net earnings are anticipated to include additional
charges to complete the previously announced restructuring program (see Note 10 of the notes to consolidated financial statements).
These charges for 2002 are estimated to be in the range of $100 million to $150 million pre-tax. In particular, the company currently
expects its European operating margins to improve in 2002, based on continued focus on productivity and restructuring initiatives.
NET SALES
The total number of units sold in 2001 increased 2% over 2000. Consolidated net sales increased slightly over 2000 despite the negative
impact from currency fluctuations. Excluding currency fluctuations, net sales would have increased 3% over 2000. Excluding the impact
of currency fluctuations, net sales were up 1% in 2000 over 1999. The tables below provide the breakdown of units and sales by region.
Management’s Discussion and Analysis