United Healthcare 2010 Annual Report Download - page 81
Download and view the complete annual report
Please find page 81 of the 2010 United Healthcare annual report below. You can navigate through the pages in the report by either clicking on the pages listed below, or by using the keyword search tool below to find specific information within the annual report.-
 1
1 -
2
-
3
-
4
-
5
-
6
-
7
-
8
-
9
-
10
-
11
-
12
-
13
-
14
-
15
-
16
-
17
-
18
-
19
-
20
-
21
-
22
-
23
-
24
-
25
-
26
-
27
-
28
-
29
-
30
-
31
-
32
-
33
-
34
-
35
-
36
-
37
-
38
-
39
-
40
-
41
-
42
-
43
-
44
-
45
-
46
-
47
-
48
-
49
-
50
-
51
-
52
-
53
-
54
-
55
-
56
-
57
-
58
-
59
-
60
-
61
-
62
-
63
-
64
-
65
-
66
-
67
-
68
-
69
-
70
-
 71
71 -
 72
72 -
 73
73 -
 74
74 -
 75
75 -
 76
76 -
 77
77 -
 78
78 -
 79
79 -
 80
80 -
 81
81 -
 82
82 -
 83
83 -
 84
84 -
 85
85 -
 86
86 -
 87
87 -
 88
88 -
 89
89 -
 90
90 -
 91
91 -
92
-
93
-
94
-
95
-
96
-
97
-
98
-
99
-
100
-
101
-
102
-
103
-
104
-
105
-
106
-
107
-
108
-
109
-
110
-
111
-
112
-
113
-
114
-
115
-
116
-
117
-
118
-
119
-
120
-
121
-
122
-
123
-
124
-
125
-
126
-
127
-
128
-
129
-
130
-
131
-
132
-
133
-
134
-
135
-
136
-
137
-
138
-
139
-
140
-
141
-
142
-
143
-
144
-
145
-
146
-
147
-
148
-
149
-
150
-
151
-
152
-
153
-
154
-
155
-
156
-
157
 |
 |

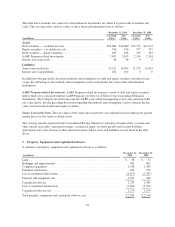
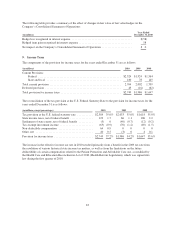
Depreciation expense for property and equipment for 2010, 2009 and 2008 was $398 million, $436 million and
$439 million, respectively. Amortization expense for capitalized software for 2010, 2009 and 2008 was $349
million, $314 million and $290 million, respectively.
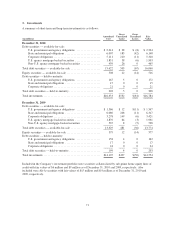
6. Goodwill and Other Intangible Assets
Changes in the carrying amount of goodwill, by reporting segment, were as follows:
(in millions)
Health
Benefits OptumHealth Ingenix
Prescription
Solutions Consolidated
Balance at January 1, 2009 .................... $17,044 $1,152 $1,052 $840 $20,088
Acquisitions ................................ 161 40 415 0 616
Subsequent payments and adjustments, net ....... 61 (34) (4) 0 23
Balance at December 31, 2009 ................. 17,266 1,158 1,463 840 20,727
Acquisitions ................................ 0 187 2,022 0 2,209
Impairment ................................ 0 0 (172) 0 (172)
Subsequent payments and adjustments, net ....... (14) 0 (5) 0 (19)
Balance at December 31, 2010 ................. $17,252 $1,345 $3,308 $840 $22,745
In 2010, there was a decline in the economic environment and competitive landscape for the clinical trial support
businesses within one of the Ingenix reporting units. These businesses experienced unexpected declines in new
business authorizations from historical levels including continued delays in and lengthening of the selling cycle.
During this time the Company began evaluating strategic options with respect to the clinical trial support
businesses. In December 2010, as part of the annual goodwill impairment analysis, the Company considered the
aforementioned market conditions and operating results as well as indications of interest the Company began to
receive on the clinical trial support businesses as the fair value of the reporting unit was evaluated. As a result of
that analysis, the Company determined that the implied fair value of the reporting unit was less than its carrying
value and an impairment charge of $172 million was recorded. The implied fair value of the reporting unit was
determined by a combination of valuation techniques, including discounting future expected cash flows and
expected sale proceeds.
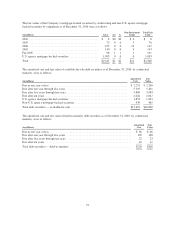
The gross carrying value, accumulated amortization and net carrying value of other intangible assets were as
follows:
December 31, 2010 December 31, 2009
(in millions)
Gross
Carrying
Value
Accumulated
Amortization
Net
Carrying
Value
Gross
Carrying
Value
Accumulated
Amortization
Net
Carrying
Value
Customer contracts and membership lists . . $3,623 $(1,038) $2,585 $2,864 $ (796) $2,068
Patents, trademarks and technology ....... 505 (246) 259 437 (187) 250
Other ............................... 132 (66) 66 118 (55) 63
Total ............................... $4,260 $(1,350) $2,910 $3,419 $(1,038) $2,381
The acquisition date fair values and weighted-average useful lives assigned to finite-lived intangible assets
acquired in business combinations consisted of the following by year of acquisition:
2010 2009
(in millions, except years)
Fair
Value
Weighted-
Average
Useful Life
Fair
Value
Weighted-
Average
Useful Life
Customer contracts and membership lists ........................... $786 14 years $239 12 years
Patents, trademarks, and technology ............................... 94 8years 41 9 years
Other ....................................................... 14 9years 1 2 years
Total acquired finite-lived intangible assets ......................... $894 13 years $281 12 years
79