United Healthcare 2010 Annual Report Download - page 54
Download and view the complete annual report
Please find page 54 of the 2010 United Healthcare annual report below. You can navigate through the pages in the report by either clicking on the pages listed below, or by using the keyword search tool below to find specific information within the annual report.-
 1
1 -
2
-
3
-
4
-
5
-
6
-
7
-
8
-
9
-
10
-
11
-
12
-
13
-
14
-
15
-
16
-
17
-
18
-
19
-
20
-
21
-
22
-
23
-
24
-
25
-
26
-
27
-
28
-
29
-
30
-
31
-
32
-
33
-
34
-
35
-
36
-
37
-
38
-
39
-
40
-
41
-
42
-
43
-
 44
44 -
 45
45 -
 46
46 -
 47
47 -
 48
48 -
 49
49 -
 50
50 -
 51
51 -
 52
52 -
 53
53 -
 54
54 -
 55
55 -
 56
56 -
 57
57 -
 58
58 -
 59
59 -
 60
60 -
 61
61 -
 62
62 -
 63
63 -
 64
64 -
65
-
66
-
67
-
68
-
69
-
70
-
71
-
72
-
73
-
74
-
75
-
76
-
77
-
78
-
79
-
80
-
81
-
82
-
83
-
84
-
85
-
86
-
87
-
88
-
89
-
90
-
91
-
92
-
93
-
94
-
95
-
96
-
97
-
98
-
99
-
100
-
101
-
102
-
103
-
104
-
105
-
106
-
107
-
108
-
109
-
110
-
111
-
112
-
113
-
114
-
115
-
116
-
117
-
118
-
119
-
120
-
121
-
122
-
123
-
124
-
125
-
126
-
127
-
128
-
129
-
130
-
131
-
132
-
133
-
134
-
135
-
136
-
137
-
138
-
139
-
140
-
141
-
142
-
143
-
144
-
145
-
146
-
147
-
148
-
149
-
150
-
151
-
152
-
153
-
154
-
155
-
156
-
157
 |
 |

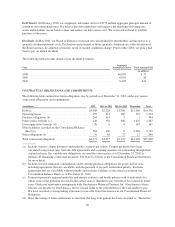
is more than the previous estimate, we will increase reported medical costs in the current period (unfavorable
development). Medical costs in 2010, 2009 and 2008, included net favorable medical cost development related to
prior periods of $800 million, $310 million and $230 million, respectively.
In developing our medical costs payable estimates, we apply different estimation methods depending on the
month for which incurred claims are being estimated. For example, we actuarially calculate completion factors
using an analysis of claim adjudication patterns over the most recent 36-month period. A completion factor is an
actuarial estimate, based upon historical experience, of the percentage of incurred claims during a given period
that have been adjudicated by us at the date of estimation. For months prior to the most recent three months, we
apply the completion factors to actual claims adjudicated-to-date to estimate the expected amount of ultimate
incurred claims for those months. For the most recent three months, we estimate claim costs incurred primarily
by applying observed medical cost trend factors to the average per member per month (PMPM) medical costs
incurred in prior months for which more complete claim data is available, supplemented by a review of near-term
completion factors. Medical cost trend factors are developed through a comprehensive analysis of claims
incurred in prior months and by reviewing a broad set of health care utilization indicators including, but not
limited to, pharmacy utilization trends, inpatient hospital census data and incidence data from the National
Centers for Disease Control. This approach is consistently applied from period to period.
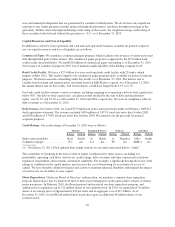
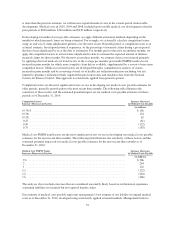
Completion factors are the most significant factors we use in developing our medical costs payable estimates for
older periods, generally periods prior to the most recent three months. The following table illustrates the
sensitivity of these factors and the estimated potential impact on our medical costs payable estimates for those
periods as of December 31, 2010:
Completion Factors
Increase (Decrease) in Factors
Increase (Decrease)
in Medical Costs Payable
(in millions)
(0.75)% ................................................................. $186
(0.50) ................................................................... 124
(0.25) ................................................................... 62
0.25 .................................................................... (61)
0.50 .................................................................... (122)
0.75 .................................................................... (183)
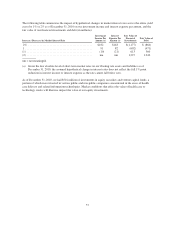
Medical cost PMPM trend factors are the most significant factors we use in developing our medical costs payable
estimates for the most recent three months. The following table illustrates the sensitivity of these factors and the
estimated potential impact on our medical costs payable estimates for the most recent three months as of
December 31, 2010:
Medical Cost PMPM Trend
Increase (Decrease) in Factors
Increase (Decrease)
in Medical Costs Payable
(in millions)
3% .................................................................... $366
2 ...................................................................... 244
1 ...................................................................... 122
(1) ..................................................................... (122)
(2) ..................................................................... (244)
(3) ..................................................................... (366)
The analyses above include outcomes that are considered reasonably likely based on our historical experience
estimating liabilities for incurred but not reported benefit claims.
Our estimate of medical costs payable represents management’s best estimate of our liability for unpaid medical
costs as of December 31, 2010, developed using consistently applied actuarial methods. Management believes
52