United Healthcare 2010 Annual Report Download - page 64
Download and view the complete annual report
Please find page 64 of the 2010 United Healthcare annual report below. You can navigate through the pages in the report by either clicking on the pages listed below, or by using the keyword search tool below to find specific information within the annual report.-
 1
1 -
2
-
3
-
4
-
5
-
6
-
7
-
8
-
9
-
10
-
11
-
12
-
13
-
14
-
15
-
16
-
17
-
18
-
19
-
20
-
21
-
22
-
23
-
24
-
25
-
26
-
27
-
28
-
29
-
30
-
31
-
32
-
33
-
34
-
35
-
36
-
37
-
38
-
39
-
40
-
41
-
42
-
43
-
44
-
45
-
46
-
47
-
48
-
49
-
50
-
51
-
52
-
53
-
 54
54 -
 55
55 -
 56
56 -
 57
57 -
 58
58 -
 59
59 -
 60
60 -
 61
61 -
 62
62 -
 63
63 -
 64
64 -
 65
65 -
 66
66 -
 67
67 -
 68
68 -
 69
69 -
 70
70 -
 71
71 -
 72
72 -
 73
73 -
 74
74 -
75
-
76
-
77
-
78
-
79
-
80
-
81
-
82
-
83
-
84
-
85
-
86
-
87
-
88
-
89
-
90
-
91
-
92
-
93
-
94
-
95
-
96
-
97
-
98
-
99
-
100
-
101
-
102
-
103
-
104
-
105
-
106
-
107
-
108
-
109
-
110
-
111
-
112
-
113
-
114
-
115
-
116
-
117
-
118
-
119
-
120
-
121
-
122
-
123
-
124
-
125
-
126
-
127
-
128
-
129
-
130
-
131
-
132
-
133
-
134
-
135
-
136
-
137
-
138
-
139
-
140
-
141
-
142
-
143
-
144
-
145
-
146
-
147
-
148
-
149
-
150
-
151
-
152
-
153
-
154
-
155
-
156
-
157
 |
 |

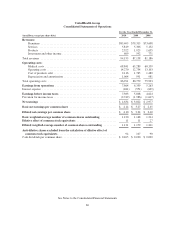
UnitedHealth Group
Consolidated Statements of Cash Flows
For the Year Ended December 31,
(in millions) 2010 2009 2008
Operating activities
Net earnings ....................................................... $4,634 $ 3,822 $ 2,977
Noncash items:
Depreciation and amortization ..................................... 1,064 991 981
Deferred income taxes ........................................... 45 (16) (166)
Share-based compensation ........................................ 326 334 305
Other ........................................................ 203 23 (122)
Net change in other operating items, net of effects from acquisitions and changes
in AARP balances:
Accounts receivable ............................................. (16) 100 (219)
Other assets ................................................... 84 (250) (48)
Medical costs payable ........................................... (88) 424 (41)
Accounts payable and other liabilities ............................... (341) 99 708
Other policy liabilities ........................................... 10 104 (170)
Unearned revenues .............................................. 352 (6) 33
Cash flows from operating activities .................................... 6,273 5,625 4,238
Investing activities
Cash paid for acquisitions, net of cash assumed ........................... (2,323) (486) (4,012)
Cash received from disposition ........................................ 19 0 199
Purchases of property, equipment and capitalized software .................. (878) (739) (791)
Proceeds from disposal of property, equipment and capitalized software ....... 0 0 185
Purchases of investments ............................................. (7,855) (6,466) (9,251)
Sales of investments ................................................. 2,593 4,040 5,568
Maturities of investments ............................................ 3,105 2,675 3,030
Cash flows used for investing activities ................................. (5,339) (976) (5,072)
Financing activities
Proceeds from (repayments of) commercial paper, net ...................... 930 (99) (1,346)
Proceeds from issuance of long-term debt ................................ 747 0 2,981
Payments for retirement of long-term debt ............................... (1,583) (1,350) (500)
Proceeds from interest rate swap termination ............................. 0 513 0
Common stock repurchases ........................................... (2,517) (1,801) (2,684)
Proceeds from common stock issuances ................................. 272 282 299
Share-based compensation excess tax benefit ............................. 27 38 62
Customer funds administered ......................................... 974 204 (461)
Dividends paid ..................................................... (449) (36) (37)
Checks outstanding ................................................. (5) 22 1,224
Other ............................................................ (7) (48) (143)
Cash flows used for financing activities ................................. (1,611) (2,275) (605)
(Decrease) increase in cash and cash equivalents ........................ (677) 2,374 (1,439)
Cash and cash equivalents, beginning of period ......................... 9,800 7,426 8,865
Cash and cash equivalents, end of period .............................. $9,123 $ 9,800 $ 7,426
Supplemental cash flow disclosures
Cash paid for interest ................................................ $ 509 $ 527 $ 621
Cash paid for income taxes ........................................... $2,725 $ 2,048 $ 1,882
See Notes to the Consolidated Financial Statements
62