United Healthcare 2010 Annual Report Download - page 74
Download and view the complete annual report
Please find page 74 of the 2010 United Healthcare annual report below. You can navigate through the pages in the report by either clicking on the pages listed below, or by using the keyword search tool below to find specific information within the annual report.-
 1
1 -
2
-
3
-
4
-
5
-
6
-
7
-
8
-
9
-
10
-
11
-
12
-
13
-
14
-
15
-
16
-
17
-
18
-
19
-
20
-
21
-
22
-
23
-
24
-
25
-
26
-
27
-
28
-
29
-
30
-
31
-
32
-
33
-
34
-
35
-
36
-
37
-
38
-
39
-
40
-
41
-
42
-
43
-
44
-
45
-
46
-
47
-
48
-
49
-
50
-
51
-
52
-
53
-
54
-
55
-
56
-
57
-
58
-
59
-
60
-
61
-
62
-
63
-
 64
64 -
 65
65 -
 66
66 -
 67
67 -
 68
68 -
 69
69 -
 70
70 -
 71
71 -
 72
72 -
 73
73 -
 74
74 -
 75
75 -
 76
76 -
 77
77 -
 78
78 -
 79
79 -
 80
80 -
 81
81 -
 82
82 -
 83
83 -
 84
84 -
85
-
86
-
87
-
88
-
89
-
90
-
91
-
92
-
93
-
94
-
95
-
96
-
97
-
98
-
99
-
100
-
101
-
102
-
103
-
104
-
105
-
106
-
107
-
108
-
109
-
110
-
111
-
112
-
113
-
114
-
115
-
116
-
117
-
118
-
119
-
120
-
121
-
122
-
123
-
124
-
125
-
126
-
127
-
128
-
129
-
130
-
131
-
132
-
133
-
134
-
135
-
136
-
137
-
138
-
139
-
140
-
141
-
142
-
143
-
144
-
145
-
146
-
147
-
148
-
149
-
150
-
151
-
152
-
153
-
154
-
155
-
156
-
157
 |
 |

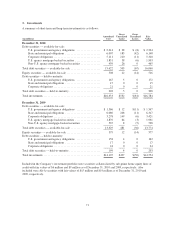
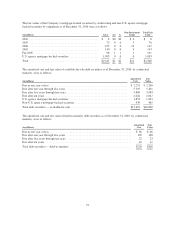
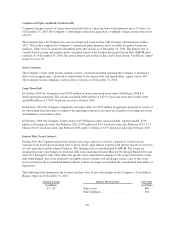
The fair values of the Company’s mortgage-backed securities by credit rating and non-U.S. agency mortgage-
backed securities by origination as of December 31, 2010 were as follows:
(in millions) AAA AA A
Non-Investment
Grade
Total Fair
Value
2010 ................................................. $ 8 $0 $0 $ 0 $ 8
2007 ................................................. 73 0 0 3 76
2006 ................................................. 123 0 0 14 137
2005 ................................................. 140 0 0 3 143
Pre-2005 .............................................. 98 1 1 1 101
U.S. agency mortgage-backed securities ..................... 1,903 0 0 0 1,903
Total ................................................. $2,345 $1 $1 $21 $2,368
The amortized cost and fair value of available-for-sale debt securities as of December 31, 2010, by contractual
maturity, were as follows:
(in millions)
Amortized
Cost
Fair
Value
Due in one year or less ....................................................... $ 2,251 $ 2,260
Due after one year through five years ........................................... 5,195 5,401
Due after five years through ten years ........................................... 3,860 3,984
Due after ten years .......................................................... 2,026 2,047
U.S. agency mortgage-backed securities ......................................... 1,851 1,903
Non-U.S. agency mortgage-backed securities ..................................... 439 465
Total debt securities — available-for-sale ........................................ $15,622 $16,060
The amortized cost and fair value of held-to-maturity debt securities as of December 31, 2010, by contractual
maturity, were as follows:
(in millions)
Amortized
Cost
Fair
Value
Due in one year or less ......................................................... $ 66 $ 66
Due after one year through five years ............................................. 105 108
Due after five years through ten years ............................................. 22 23
Due after ten years ............................................................ 10 11
Total debt securities — held-to-maturity ........................................... $203 $208
72