United Healthcare 2010 Annual Report Download - page 49
Download and view the complete annual report
Please find page 49 of the 2010 United Healthcare annual report below. You can navigate through the pages in the report by either clicking on the pages listed below, or by using the keyword search tool below to find specific information within the annual report.-
 1
1 -
2
-
3
-
4
-
5
-
6
-
7
-
8
-
9
-
10
-
11
-
12
-
13
-
14
-
15
-
16
-
17
-
18
-
19
-
20
-
21
-
22
-
23
-
24
-
25
-
26
-
27
-
28
-
29
-
30
-
31
-
32
-
33
-
34
-
35
-
36
-
37
-
38
-
 39
39 -
 40
40 -
 41
41 -
 42
42 -
 43
43 -
 44
44 -
 45
45 -
 46
46 -
 47
47 -
 48
48 -
 49
49 -
 50
50 -
 51
51 -
 52
52 -
 53
53 -
 54
54 -
 55
55 -
 56
56 -
 57
57 -
 58
58 -
 59
59 -
60
-
61
-
62
-
63
-
64
-
65
-
66
-
67
-
68
-
69
-
70
-
71
-
72
-
73
-
74
-
75
-
76
-
77
-
78
-
79
-
80
-
81
-
82
-
83
-
84
-
85
-
86
-
87
-
88
-
89
-
90
-
91
-
92
-
93
-
94
-
95
-
96
-
97
-
98
-
99
-
100
-
101
-
102
-
103
-
104
-
105
-
106
-
107
-
108
-
109
-
110
-
111
-
112
-
113
-
114
-
115
-
116
-
117
-
118
-
119
-
120
-
121
-
122
-
123
-
124
-
125
-
126
-
127
-
128
-
129
-
130
-
131
-
132
-
133
-
134
-
135
-
136
-
137
-
138
-
139
-
140
-
141
-
142
-
143
-
144
-
145
-
146
-
147
-
148
-
149
-
150
-
151
-
152
-
153
-
154
-
155
-
156
-
157
 |
 |

the case of extraordinary dividends, these standards generally permit dividends to be paid from statutory
unassigned surplus of the regulated subsidiary and are limited based on the regulated subsidiary’s level of
statutory net income and statutory capital and surplus. These dividends are referred to as “ordinary dividends”
and generally can be paid without prior regulatory approval. If the dividend, together with other dividends paid
within the preceding twelve months, exceeds a specified statutory limit or is paid from sources other than earned
surplus, the entire dividend is generally considered an “extraordinary dividend” and must receive prior regulatory
approval.
In 2010, based on the 2009 statutory net income and statutory capital and surplus levels, the maximum amount of
ordinary dividends which could be paid was $3.2 billion. For the year ended December 31, 2010, our regulated
subsidiaries paid their parent companies dividends of $3.2 billion, including $686 million of extraordinary
dividends. For the year ended December 31, 2009, our regulated subsidiaries paid their parent companies
dividends of $4.2 billion, including $2.5 billion of extraordinary dividends. The total dividends received in both
2010 and 2009 included all of the ordinary dividend capacity of $3.2 billion and $3.1 billion, respectively. In
some cases, ordinary dividends were classified as extraordinary dividends due to their increased size and/or
accelerated timing.
Our non-regulated businesses also generate cash flows from operations for general corporate use. Cash flows
generated by these entities, combined with dividends from our regulated entities and financing through the
issuance of commercial paper and long-term debt, as well as the availability of our committed credit facility,
further strengthen our operating and financial flexibility. We generally use these cash flows to expand our
businesses through acquisitions, reinvest in our businesses through capital expenditures, repay debt, or return
capital to our shareholders through shareholder dividends and/or repurchases of our common stock, depending on
market conditions.
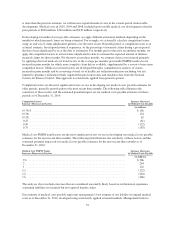
Results
A summary of our major sources and uses of cash is reflected in the table below:
Year Ended December 31,
(in millions) 2010 2009 2008
Sources of cash:
Cash provided by operating activities ............................. $ 6,273 $ 5,625 $ 4,238
Sales of investments ........................................... 2,593 4,040 5,568
Maturities of investments ....................................... 3,105 2,675 3,030
Proceeds from customer funds administered ........................ 974 204 0
Proceeds from issuance of commercial paper, net .................... 930 0 0
Proceeds from issuance of long-term debt .......................... 747 0 2,981
Interest rate swap termination ................................... 0 513 0
Other ....................................................... 299 342 1,770
Total sources of cash .............................................. 14,921 13,399 17,587
Uses of cash:
Purchases of investments ....................................... (7,855) (6,466) (9,251)
Cash paid for acquisitions, net of cash assumed and disposition ......... (2,304) (486) (3,813)
Retirement of long-term debt .................................... (1,583) (1,350) (500)
Common stock repurchases ..................................... (2,517) (1,801) (2,684)
Purchases of property, equipment and capitalized software ............ (878) (739) (791)
Dividends paid ............................................... (449) (36) (37)
Repayments of commercial paper, net ............................. 0 (99) (1,346)
Other ....................................................... (12) (48) (604)
Total uses of cash ................................................. (15,598) (11,025) (19,026)
Net (decrease) increase in cash ...................................... $ (677) $ 2,374 $ (1,439)
47