United Healthcare 2010 Annual Report Download - page 35
Download and view the complete annual report
Please find page 35 of the 2010 United Healthcare annual report below. You can navigate through the pages in the report by either clicking on the pages listed below, or by using the keyword search tool below to find specific information within the annual report.-
 1
1 -
2
-
3
-
4
-
5
-
6
-
7
-
8
-
9
-
10
-
11
-
12
-
13
-
14
-
15
-
16
-
17
-
18
-
19
-
20
-
21
-
22
-
23
-
24
-
 25
25 -
 26
26 -
 27
27 -
 28
28 -
 29
29 -
 30
30 -
 31
31 -
 32
32 -
 33
33 -
 34
34 -
 35
35 -
 36
36 -
 37
37 -
 38
38 -
 39
39 -
 40
40 -
 41
41 -
 42
42 -
 43
43 -
 44
44 -
 45
45 -
46
-
47
-
48
-
49
-
50
-
51
-
52
-
53
-
54
-
55
-
56
-
57
-
58
-
59
-
60
-
61
-
62
-
63
-
64
-
65
-
66
-
67
-
68
-
69
-
70
-
71
-
72
-
73
-
74
-
75
-
76
-
77
-
78
-
79
-
80
-
81
-
82
-
83
-
84
-
85
-
86
-
87
-
88
-
89
-
90
-
91
-
92
-
93
-
94
-
95
-
96
-
97
-
98
-
99
-
100
-
101
-
102
-
103
-
104
-
105
-
106
-
107
-
108
-
109
-
110
-
111
-
112
-
113
-
114
-
115
-
116
-
117
-
118
-
119
-
120
-
121
-
122
-
123
-
124
-
125
-
126
-
127
-
128
-
129
-
130
-
131
-
132
-
133
-
134
-
135
-
136
-
137
-
138
-
139
-
140
-
141
-
142
-
143
-
144
-
145
-
146
-
147
-
148
-
149
-
150
-
151
-
152
-
153
-
154
-
155
-
156
-
157
 |
 |
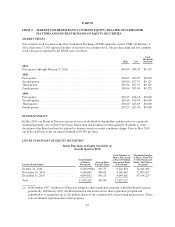
(b) Represents 9,226,858 shares of our common stock repurchased during the period and 2,140 shares of our
common stock withheld by us, as permitted by the applicable equity award certificates, to satisfy tax
withholding obligations upon vesting of shares of restricted stock.
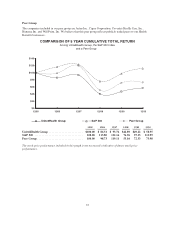
PERFORMANCE GRAPHS
The following two performance graphs compare our total return to shareholders with indexes of other specified
companies and the S&P 500 Index. The first graph compares the cumulative five-year total return to shareholders
on our common stock relative to the cumulative total returns of the S&P 500 index and a customized peer group
of certain Fortune 50 companies (the “Fortune 50 Group”), for the five-year period ended December 31, 2010.
The second graph compares our cumulative total return to shareholders with the S&P 500 Index and an index of a
group of peer companies selected by us for the five-year period ended December 31, 2010. We are not included
in either the Fortune 50 Group index in the first graph or the peer group index in the second graph. In calculating
the cumulative total shareholder return of the indexes, the shareholder returns of the Fortune 50 Group
companies in the first graph and the peer group companies in the second graph are weighted according to the
stock market capitalizations of the companies at January 1 of each year. The comparisons assume the investment
of $100 on December 31, 2005 in our common stock and in each index, and that dividends were reinvested when
paid.
33