United Healthcare 2010 Annual Report Download - page 80
Download and view the complete annual report
Please find page 80 of the 2010 United Healthcare annual report below. You can navigate through the pages in the report by either clicking on the pages listed below, or by using the keyword search tool below to find specific information within the annual report.-
 1
1 -
2
-
3
-
4
-
5
-
6
-
7
-
8
-
9
-
10
-
11
-
12
-
13
-
14
-
15
-
16
-
17
-
18
-
19
-
20
-
21
-
22
-
23
-
24
-
25
-
26
-
27
-
28
-
29
-
30
-
31
-
32
-
33
-
34
-
35
-
36
-
37
-
38
-
39
-
40
-
41
-
42
-
43
-
44
-
45
-
46
-
47
-
48
-
49
-
50
-
51
-
52
-
53
-
54
-
55
-
56
-
57
-
58
-
59
-
60
-
61
-
62
-
63
-
64
-
65
-
66
-
67
-
68
-
69
-
 70
70 -
 71
71 -
 72
72 -
 73
73 -
 74
74 -
 75
75 -
 76
76 -
 77
77 -
 78
78 -
 79
79 -
 80
80 -
 81
81 -
 82
82 -
 83
83 -
 84
84 -
 85
85 -
 86
86 -
 87
87 -
 88
88 -
 89
89 -
 90
90 -
91
-
92
-
93
-
94
-
95
-
96
-
97
-
98
-
99
-
100
-
101
-
102
-
103
-
104
-
105
-
106
-
107
-
108
-
109
-
110
-
111
-
112
-
113
-
114
-
115
-
116
-
117
-
118
-
119
-
120
-
121
-
122
-
123
-
124
-
125
-
126
-
127
-
128
-
129
-
130
-
131
-
132
-
133
-
134
-
135
-
136
-
137
-
138
-
139
-
140
-
141
-
142
-
143
-
144
-
145
-
146
-
147
-
148
-
149
-
150
-
151
-
152
-
153
-
154
-
155
-
156
-
157
 |
 |

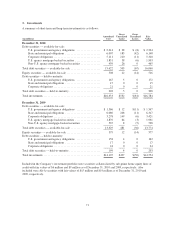
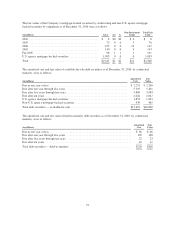
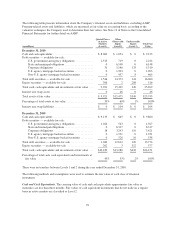
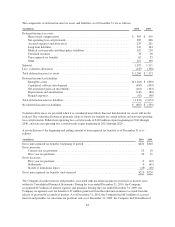
The table below includes fair values for certain financial instruments for which it is practicable to estimate fair
value. The carrying values and fair values of these financial instruments were as follows:
December 31, 2010 December 31, 2009
(in millions)
Carrying
Value
Fair
Value
Carrying
Value
Fair
Value
Assets
Debt securities — available-for-sale ............................ $16,060 $16,060 $13,774 $13,774
Equity securities — available-for-sale .......................... 516 516 577 577
Debt securities — held-to-maturity ............................. 203 208 199 203
AARP Program-related investments ............................ 2,435 2,435 2,114 2,114
Interest rate swap assets ..................................... 46 46 0 0
Liabilities
Senior unsecured notes ...................................... 10,212 10,903 11,173 11,043
Interest rate swap liabilities ................................... 104 104 0 0
In addition to the previously described methods and assumptions for debt and equity securities and interest rate
swaps, the following are the methods and assumptions used to estimate the fair value of the other financial
instruments:
AARP Program-related Investments. AARP Program-related investments consist of debt and equity securities
held to fund costs associated with the AARP Program (see Note 12 of Notes to the Consolidated Financial
Statements). The Company elected to measure the AARP assets under management at fair value pursuant to the
fair value option. See the preceding discussion regarding the methods and assumptions used to estimate the fair
value of investments in debt and equity securities.
Senior Unsecured Notes. The fair values of the senior unsecured notes are estimated based on third-party quoted
market prices for the same or similar issues.
The carrying amounts reported in the Consolidated Balance Sheets for cash and cash equivalents, accounts and
other current receivables, unearned revenues, commercial paper, accounts payable and accrued liabilities
approximate fair value because of their short-term nature. These assets and liabilities are not listed in the table
above.
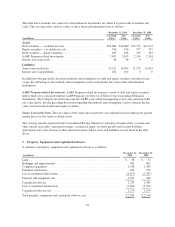
5. Property, Equipment and Capitalized Software
A summary of property, equipment and capitalized software is as follows:
(in millions)
December 31,
2010
December 31,
2009
Land ................................................................ $ 38 $ 32
Buildings and improvements ............................................. 764 662
Computer equipment ................................................... 1,418 1,504
Furniture and fixtures ................................................... 224 235
Less accumulated depreciation ........................................... (1,417) (1,487)
Property and equipment, net ............................................. 1,027 946
Capitalized software .................................................... 2,535 2,445
Less accumulated amortization ........................................... (1,362) (1,251)
Capitalized software, net ................................................ 1,173 1,194
Total property, equipment and capitalized software, net ........................ $2,200 $ 2,140
78