Unilever 2015 Annual Report Download - page 19
Download and view the complete annual report
Please find page 19 of the 2015 Unilever annual report below. You can navigate through the pages in the report by either clicking on the pages listed below, or by using the keyword search tool below to find specific information within the annual report.-
 1
1 -
2
-
3
-
4
-
5
-
6
-
7
-
8
-
 9
9 -
 10
10 -
 11
11 -
 12
12 -
 13
13 -
 14
14 -
 15
15 -
 16
16 -
 17
17 -
 18
18 -
 19
19 -
 20
20 -
 21
21 -
 22
22 -
 23
23 -
 24
24 -
 25
25 -
 26
26 -
 27
27 -
 28
28 -
 29
29 -
30
-
31
-
32
-
33
-
34
-
35
-
36
-
37
-
38
-
39
-
40
-
41
-
42
-
43
-
44
-
45
-
46
-
47
-
48
-
49
-
50
-
51
-
52
-
53
-
54
-
55
-
56
-
57
-
58
-
59
-
60
-
61
-
62
-
63
-
64
-
65
-
66
-
67
-
68
-
69
-
70
-
71
-
72
-
73
-
74
-
75
-
76
-
77
-
78
-
79
-
80
-
81
-
82
-
83
-
84
-
85
-
86
-
87
-
88
-
89
-
90
-
91
-
92
-
93
-
94
-
95
-
96
-
97
-
98
-
99
-
100
-
101
-
102
-
103
-
104
-
105
-
106
-
107
-
108
-
109
-
110
-
111
-
112
-
113
-
114
-
115
-
116
-
117
-
118
-
119
-
120
-
121
-
122
-
123
-
124
-
125
-
126
-
127
-
128
-
129
-
130
-
131
-
132
-
133
-
134
-
135
-
136
-
137
-
138
-
139
-
140
-
141
-
142
-
143
-
144
-
145
-
146
-
147
-
148
-
149
-
150
-
151
-
152
-
153
-
154
-
155
-
156
-
157
-
158
-
159
-
160
-
161
-
162
-
163
-
164
-
165
-
166
-
167
-
168
-
169
 |
 |

THE BENEFITS THAT OUR VISION AND STRATEY
DELIVER TRANSLATE INTO PERFORMANE FOR
SHAREHOLDERS AND SOIETY AT LARE
* Key Fnancal Indcators These measures are non-AAP measures For further nformaton about these measures, and the reasons why we beleve they
are mportant for an understandng of the performance of the busness, please refer to our commentary on non-AAP measures on pages 38 and 39
FINANIAL PERFORMANE
ROWIN THE BUSINESS ROUP
UNDERLYIN SALES
ROWTH*
2015
41%
2014 29%
Underlyng sales growth
averaged 49% over fve years
UNDERLYIN VOLUME
ROWTH*
2015
21%
2014 10%
Underlyng volume growth
averaged 21% over fve years
ORE OPERATIN
MARIN*
2015
148%
2014 145%
ore operatng margn has
steadly ncreased over fve
years from 135% to 148%
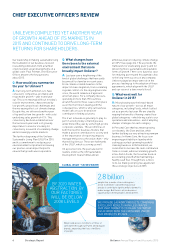
FREE ASH FLOW*
2015
48 bllon
2014 31 bllon
Unlever has generated free
cash flow of 192 bllon over
fve years
ROWIN THE BUSINESS ATEORIES
PERSONAL ARE
Turnover
201 bllon
2014 177 bllon
Underlyng sales growth
41%
2014 35%
ore operatng margn
189%
2014 187%
FOODS
Turnover
129 bllon
2014 124 bllon
Underlyng sales growth
15%
2014 (06)%
ore operatng margn
182%
2014 186%
REFRESHMENT
Turnover
101 bllon
2014 92 bllon
Underlyng sales growth
54%
2014 38%
ore operatng margn
94%
2014 88%
HOME ARE
Turnover
102 bllon
2014 92 bllon
Underlyng sales growth
59%
2014 58%
ore operatng margn
76%
2014 63%
16 Unilever Annual Report and Accounts 2015Strategic Report
OUR PERFORMANE