Under Armour 2014 Annual Report Download - page 64
Download and view the complete annual report
Please find page 64 of the 2014 Under Armour annual report below. You can navigate through the pages in the report by either clicking on the pages listed below, or by using the keyword search tool below to find specific information within the annual report.-
 1
1 -
2
-
3
-
4
-
5
-
6
-
7
-
8
-
9
-
10
-
11
-
12
-
13
-
14
-
15
-
16
-
17
-
18
-
19
-
20
-
21
-
22
-
23
-
24
-
25
-
26
-
27
-
28
-
29
-
30
-
31
-
32
-
33
-
34
-
35
-
36
-
37
-
38
-
39
-
40
-
41
-
42
-
43
-
44
-
45
-
46
-
47
-
48
-
49
-
50
-
51
-
52
-
53
-
 54
54 -
 55
55 -
 56
56 -
 57
57 -
 58
58 -
 59
59 -
 60
60 -
 61
61 -
 62
62 -
 63
63 -
 64
64 -
 65
65 -
 66
66 -
 67
67 -
 68
68 -
 69
69 -
 70
70 -
 71
71 -
 72
72 -
 73
73 -
 74
74 -
75
-
76
-
77
-
78
-
79
-
80
-
81
-
82
-
83
-
84
-
85
-
86
-
87
-
88
-
89
-
90
-
91
-
92
-
93
-
94
-
95
-
96
-
97
-
98
-
99
-
100
-
101
-
102
-
103
-
104
 |
 |

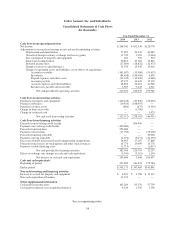
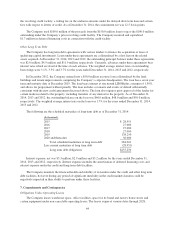
Under Armour, Inc. and Subsidiarie
s
C
onsolidated
S
tatements of
C
ash Flows
(
In thousands
)
Y
ear Ended December
31,
2014
2013
2012
C
ash
f
lows
f
rom operat
i
ng act
i
v
i
t
i
e
s
Net income
$
208,042
$
162,330
$
128,77
8
Ad
j
ustments to reconcile net income to net cash used in operatin
g
activitie
s
De
p
reciation and amortization 72,093 50,549 43,08
2
Unrealized foreign currency exchange rate losses (gains) 11,739 1,90
5
(2,464
)
Loss on disposal of propert
y
and equipment 261 332
5
2
4
Stock-based com
p
ensation 50,812 43,184 19,84
5
Deferred income taxes (17,
5
84) (18,832) (12,973
)
Changes in reserves and allowances 31,3
5
0 13,94
5
13,91
6
Chan
g
es in operatin
g
assets and liabilities, net of effects of acquisitions:
Accounts receivable
(
101,057
)(
35,960
)(
53,433
)
Inventories (84,6
5
8) (1
5
6,900) 4,69
9
Pre
p
aid ex
p
enses and other assets (33,345) (19,049) (4,060
)
Accounts pa
y
able 49,137 14,642 35,370
Accrued expenses and other liabilities 28,8
5
6
5
6,481 21,96
6
Income taxes payable and receivable 3,387 7,443 4,
5
1
1
Net cash provided by operating activities 219,033 120,070 199,7
61
C
ash
f
lows
f
rom
i
nvest
i
ng act
i
v
i
t
i
es
Purchases of propert
y
and equipment (140,528) (87,830) (50,650
)
Purchase of business
(
10,924
)(
148,097
)—
Purchases of other assets (860) (47
5
) (1,310)
Chan
g
e in loans receivable — (1,700)
—
Chan
g
e in restricted cash — — 5,029
Net cash used in investing activities (1
5
2,312) (238,102) (46,931
)
C
ash
f
lows
f
rom
fi
nanc
i
ng act
i
v
i
t
i
es
Procee
d
s
f
rom revo
l
v
i
ng cre
di
t
f
ac
ili
ty — 100,000
—
Pa
y
ments on revolvin
g
credit facilit
y
(100,000) — —
Proceeds from term loan 250
,
000 —
—
Payments on term loan (13,7
5
0) — (2
5
,000)
Proceeds from lon
g
term debt — —
5
0,00
0
Pa
y
ments on lon
g
term debt (4,972) (5,471) (44,330)
Excess tax benefits from stock-based compensation arrangements 36,96
5
17,167 17,86
8
Proceeds from exercise of stock options and other stock issuances 1
5
,776 1
5
,099 14,776
Pa
y
ments of debt financin
g
costs (1,713) — (1,017)
Net cash provided by financing activities 182,306 126,79
5
12,29
7
Effect of exchange rate changes on cash and cash equivalents (3,341) (3,11
5
) 1,33
0
Net increase in cash and cash equivalents 24
5
,686
5
,648 166,4
5
7
Cash and cash e
q
uivalent
s
Be
g
innin
g
of period 347,489 341,841 175,38
4
End of period $ 593,175 $ 347,489 $341,84
1
Non-cash
i
nvest
i
ng and
fi
nanc
i
ng act
i
v
i
t
i
e
s
Increase in accrual for property and equipment
$
4,922
$
3,786
$
12,13
7
Non-cash ac
q
uisition of business 11,233 —
—
Other su
pp
lemental information
Cash paid for income taxes 103,284 8
5
,
5
70
5
7,739
Cash paid for interest, net of capitalized interest 4,146 1,
5
0
5
3,30
6
See accompan
y
in
g
notes.
54