Under Armour 2014 Annual Report Download - page 46
Download and view the complete annual report
Please find page 46 of the 2014 Under Armour annual report below. You can navigate through the pages in the report by either clicking on the pages listed below, or by using the keyword search tool below to find specific information within the annual report.-
 1
1 -
2
-
3
-
4
-
5
-
6
-
7
-
8
-
9
-
10
-
11
-
12
-
13
-
14
-
15
-
16
-
17
-
18
-
19
-
20
-
21
-
22
-
23
-
24
-
25
-
26
-
27
-
28
-
29
-
30
-
31
-
32
-
33
-
34
-
35
-
 36
36 -
 37
37 -
 38
38 -
 39
39 -
 40
40 -
 41
41 -
 42
42 -
 43
43 -
 44
44 -
 45
45 -
 46
46 -
 47
47 -
 48
48 -
 49
49 -
 50
50 -
 51
51 -
 52
52 -
 53
53 -
 54
54 -
 55
55 -
 56
56 -
57
-
58
-
59
-
60
-
61
-
62
-
63
-
64
-
65
-
66
-
67
-
68
-
69
-
70
-
71
-
72
-
73
-
74
-
75
-
76
-
77
-
78
-
79
-
80
-
81
-
82
-
83
-
84
-
85
-
86
-
87
-
88
-
89
-
90
-
91
-
92
-
93
-
94
-
95
-
96
-
97
-
98
-
99
-
100
-
101
-
102
-
103
-
104
 |
 |

N
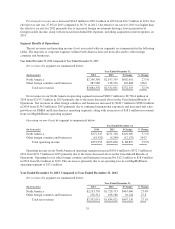
et revenues in our North American operating segment increased
$
467.0 million to
$
2,193.7 million i
n
2013 from
$
1,726.7 million in 2012 primarily due to the items discussed above in the Consolidated Results o
f
Operations. Net revenues in other foreign countries and businesses increased by
$
30.1 million to
$
138.3 million
in 2013 from
$
108.2 million in 2012 primarily due to unit sales growth in our EMEA and Asia operating
segments and to distributors in our Latin American operating segment
.
O
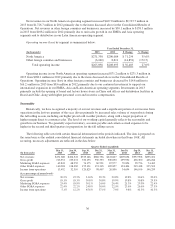
perating income (loss) by segment is summarized below:
Y
ear Ended December 31
,
(
In t
h
ousan
d
s
)
201
3
2
0
1
2
$
Change % Chang
e
N
orth America
$
271,338
$
200,084
$
71,254 35.6%
Other foreign countries and businesses (6,240) 8,611 (14,8
5
1) (172.
5
)
T
otal operatin
g
income
$
265,098
$
208,695
$
56,403 27.0
%
Operatin
g
income in our North American operatin
g
se
g
ment increased
$
71.2 million to
$
271.3 million in
2013 from
$
200.1 million in 2012 primarily due to the items discussed above in the Consolidated Results o
f
Operations. Operating income (loss) in other foreign countries and businesses decreased by
$
14.8 million to
$
(6.2) million in 2013 from
$
8.6 million in 2012 primarily due to our continued investment to support our
i
nternat
i
ona
l
expans
i
on
i
n our EMEA, As
i
aan
d
Lat
i
n Amer
i
can operat
i
ng segments. Investments
i
n 2013
p
r
i
mar
il
y
i
nc
l
u
d
et
h
e open
i
ng o
fb
ran
d
an
df
actory
h
ouse stores
i
nC
hi
na an
d
o
ffi
ces an
ddi
str
ib
ut
i
on
f
ac
ili
t
i
es
i
n
B
raz
il
an
d
C
hil
e, a
l
ong w
i
t
hhi
g
h
er personne
l
costs an
di
ncent
i
ve compensat
i
on
.
S
easonality
H
i
stor
i
ca
ll
y, we
h
ave recogn
i
ze
d
ama
j
or
i
ty o
f
our net revenues an
d
as
i
gn
ifi
cant port
i
on o
f
our
i
ncome
f
rom
o
perat
i
ons
i
nt
h
e
l
ast two quarters o
f
t
h
e year,
d
r
i
ven pr
i
mar
il
y
b
y
i
ncrease
d
sa
l
es vo
l
ume o
f
our pro
d
ucts
d
ur
i
n
g
t
h
e
f
a
ll
se
lli
ng season,
i
nc
l
u
di
ng our
hi
g
h
er pr
i
ce
d
co
ld
weat
h
er pro
d
ucts, a
l
ong w
i
t
h
a
l
arger proport
i
on o
f
hi
g
h
er marg
i
n
di
rect to consumer sa
l
es. T
h
e
l
eve
l
o
f
our wor
ki
ng cap
i
ta
l
genera
ll
yre
fl
ects t
h
e seasona
li
ty an
d
growt
hi
n our
b
us
i
ness. We genera
ll
y expect
i
nventory, accounts paya
bl
ean
d
certa
i
n accrue
d
expenses to
be
hi
g
h
er
i
nt
h
e secon
d
an
d
t
hi
r
d
quarters
i
n preparat
i
on
f
or t
h
e
f
a
ll
se
lli
ng season
.
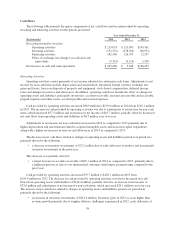
T
h
e
f
o
ll
ow
i
ng ta
bl
e sets
f
ort
h
certa
i
n
fi
nanc
i
a
li
n
f
ormat
i
on
f
or t
h
e per
i
o
d
s
i
n
di
cate
d
.T
h
e
d
ata
i
s prepare
d
o
n
t
h
e same
b
as
i
sast
h
eau
di
te
d
conso
lid
ate
dfi
nanc
i
a
l
statements
i
nc
l
u
d
e
d
e
l
sew
h
ere
i
nt
hi
s Form 10-K. A
ll
r
ecurr
i
ng, necessary a
dj
ustments are re
fl
ecte
di
nt
h
e
d
ata
b
e
l
ow
.
Q
uarter Ended (unaudited)
(
In t
h
ousan
d
s
)
Mar 31
,
2013
Jun 30,
2
01
3
S
ep 30,
2013
D
ec 31,
201
3
M
ar 31,
20
1
4
Jun 30
,
2
0
1
4
S
ep 30
,
2
0
14
Dec 31
,
20
1
4
Net revenues
$
471,608
$
454,541
$
723,146
$
682,756
$
641,607
$
609,654
$
937,908
$
895,201
Gross
p
rofit 216,551 219,631 350,135 350,353 300,690 299,952 465,300 446,264
Marketin
g
SG&A expenses 62,841 48,952 74,175 60,521 87,977 70,854 99,756 74,462
Other SG&A ex
p
enses 140,218 138,369 155,131 191,365 185,857 194,404 219,438 225,50
3
Income from o
p
erations 13,492 32,310 120,829 98,467 26,856 34,694 146,106 146,299
(
As a
p
ercentage o
f
annua
l
tota
l
s)
Net revenues 20.2% 19.5% 31.0% 29.3% 20.8% 19.8% 30.4% 29.0%
Gross
p
rofit 19.1% 19.3% 30.8% 30.8% 19.9% 19.8% 30.8% 29.5%
Marketin
g
SG&A expenses 25.4% 19.9% 30.1% 24.6% 26.4% 21.3% 29.9% 22.4%
Other SG&A ex
p
enses 22.4% 22.2% 24.8% 30.6% 22.5% 23.6% 26.6% 27.3
%
Income from o
p
erations 5.1% 12.2% 45.6% 37.1% 7.6% 9.8% 41.3% 41.3%
36