Under Armour 2014 Annual Report Download - page 43
Download and view the complete annual report
Please find page 43 of the 2014 Under Armour annual report below. You can navigate through the pages in the report by either clicking on the pages listed below, or by using the keyword search tool below to find specific information within the annual report.-
 1
1 -
2
-
3
-
4
-
5
-
6
-
7
-
8
-
9
-
10
-
11
-
12
-
13
-
14
-
15
-
16
-
17
-
18
-
19
-
20
-
21
-
22
-
23
-
24
-
25
-
26
-
27
-
28
-
29
-
30
-
31
-
32
-
 33
33 -
 34
34 -
 35
35 -
 36
36 -
 37
37 -
 38
38 -
 39
39 -
 40
40 -
 41
41 -
 42
42 -
 43
43 -
 44
44 -
 45
45 -
 46
46 -
 47
47 -
 48
48 -
 49
49 -
 50
50 -
 51
51 -
 52
52 -
 53
53 -
54
-
55
-
56
-
57
-
58
-
59
-
60
-
61
-
62
-
63
-
64
-
65
-
66
-
67
-
68
-
69
-
70
-
71
-
72
-
73
-
74
-
75
-
76
-
77
-
78
-
79
-
80
-
81
-
82
-
83
-
84
-
85
-
86
-
87
-
88
-
89
-
90
-
91
-
92
-
93
-
94
-
95
-
96
-
97
-
98
-
99
-
100
-
101
-
102
-
103
-
104
 |
 |

•
Cor
p
orate services costs increased
$
36.8 million to
$
212.8 million in 2014 from
$
176.0 million in 201
3
p
rimarily due to higher personnel and other administrative costs necessary to support our growth. As a
p
ercentage of net revenues, corporate services costs decreased to 6.9% in 2014 from 7.
5
%in201
3
p
rimarily due to higher incentive compensation in the prior year
.
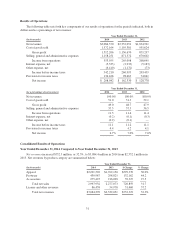
Income
f
rom operation
s
i
ncreased
$
88.9 million, or 33.5%, to
$
354.0 million in 2014 from
$
265.1 million in
2013. Income from operations as a percentage of net revenues increased to 11.
5
% in 2014 from 11.4% in 2013
.
Interest ex
p
ense, ne
t
increased
$
2.4 million to
$
5.3 million in 2014 from
$
2.9 million in 2013. This increas
e
was primarily due to the
$
150.0 million and
$
100.0 million term loans we entered into during 2014.
O
ther ex
p
ense, ne
t
i
ncreased
$
5.2 million to
$
6.4 million in 2014 from
$
1.2 million in 2013. This increas
e
was due to higher net losses in 2014 on the combined foreign currency exchange rate changes on transaction
s
denominated in foreign currencies and our foreign currency derivative financial instruments as compared t
o
2013
.
P
rovision
f
or income taxe
s
i
ncreased
$
35.5 million to
$
134.2 million in 2014 from
$
98.7 million in 2013.
Our effective tax rate was 39.2% in 2014 compared to 37.8% in 2013. Our effective tax rate for 2014 was higher
than the effective tax rate for 2013 primarily due to increased foreign investments driving a lower proportion o
f
f
oreign taxable income in 2014 and state tax credits received in 2013
.
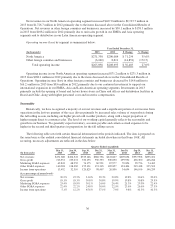
Year Ended December 31, 2013
C
om
p
ared to Year Ended December 31, 201
2
Net revenue
s
i
ncreased
$
497.2 million, or 27.1%, to
$
2,332.1 million in 2013 from
$
1,834.9 million i
n
2012. Net revenues by product category are summarized below:
Year Ended December 31,
(In t
h
ousan
d
s
)
2013 2
0
1
2
$
Chang
e
% Chang
e
App
arel
$
1,762,150
$
1,385,350
$
376,800 27.2%
F
ootwear 298,82
5
238,9
55 5
9,870 2
5
.1
A
ccessories 216,098 16
5
,83
55
0,263 30.
3
T
otal net sales 2
,
277
,
073 1
,
790
,
140 486
,
933 27.
2
L
icense and other revenues 54
,
978 44
,
781 10
,
197 22.8
T
otal net revenues $2,332,051 $1,834,921 $497,130 27.1
%
Net sa
l
e
s
increased $487.0 million, or 27.2%, to $2,277.1 million in 2013 from $1,790.1 million in 2012 as
note
di
nt
h
eta
bl
ea
b
ove. T
h
e
i
ncrease
i
n net sa
l
es pr
i
mar
ily
re
fl
ects:
•
$176.8 million, or 33.2%, increase in direct to consumer sales, which includes 18 additional retai
l
stores, or a 16.5%
g
rowth, since December 31, 2012, and continued
g
rowth in our e-commerce
business
;
•
unit
g
rowth driven b
y
increased distribution and new offerin
g
s in multiple product cate
g
ories, mos
t
si
g
nificantl
y
in our trainin
g
and huntin
g
apparel product cate
g
ories, includin
g
our new UA
H
EAT
G
EAR
®
S
onic and
U
A
CO
LD
G
EAR
®
Infrared product lines alon
g
with continued
g
rowth in ou
r
U
A Storm and Char
g
ed Cotton
®
platforms, and runnin
g
apparel and footwear, includin
g
UA Spine
;
a
nd
•
increased avera
g
e sellin
g
prices driven primaril
y
from our hi
g
her priced apparel products, includin
g
our mountain cate
g
or
y
and women’s UA Studio line.
33