Under Armour 2014 Annual Report Download - page 41
Download and view the complete annual report
Please find page 41 of the 2014 Under Armour annual report below. You can navigate through the pages in the report by either clicking on the pages listed below, or by using the keyword search tool below to find specific information within the annual report.-
 1
1 -
2
-
3
-
4
-
5
-
6
-
7
-
8
-
9
-
10
-
11
-
12
-
13
-
14
-
15
-
16
-
17
-
18
-
19
-
20
-
21
-
22
-
23
-
24
-
25
-
26
-
27
-
28
-
29
-
30
-
 31
31 -
 32
32 -
 33
33 -
 34
34 -
 35
35 -
 36
36 -
 37
37 -
 38
38 -
 39
39 -
 40
40 -
 41
41 -
 42
42 -
 43
43 -
 44
44 -
 45
45 -
 46
46 -
 47
47 -
 48
48 -
 49
49 -
 50
50 -
 51
51 -
52
-
53
-
54
-
55
-
56
-
57
-
58
-
59
-
60
-
61
-
62
-
63
-
64
-
65
-
66
-
67
-
68
-
69
-
70
-
71
-
72
-
73
-
74
-
75
-
76
-
77
-
78
-
79
-
80
-
81
-
82
-
83
-
84
-
85
-
86
-
87
-
88
-
89
-
90
-
91
-
92
-
93
-
94
-
95
-
96
-
97
-
98
-
99
-
100
-
101
-
102
-
103
-
104
 |
 |

R
esults o
fOp
erat
i
ons
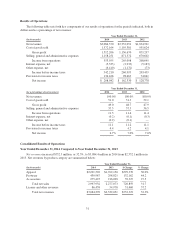
The following table sets forth key components of our results of operations for the periods indicated, both i
n
dollars and as a percentage of net revenues:
Y
ear Ended December 31
,
(In t
h
ousan
d
s
)
2014
2013
2012
N
et revenues
$
3,084,370
$
2,332,051
$
1,834,921
Cost of goods sold 1,
5
72,164 1,19
5
,381 9
55
,624
G
ross profit 1,512,206 1,136,670 879,297
S
ellin
g
,
g
eneral and administrative expenses 1,158,251 871,572 670,60
2
Income from operations 353,955 265,098 208,695
I
nterest expense, net (5,335) (2,933) (5,183)
Other expense, net (
6
,410) (1,172) (73)
Income before income taxes 342,210 2
6
0,993 203,439
Provision for income taxes 134,1
6
8 98,
66
3 74,
661
Net income
$
208
,
042
$
162
,
330
$
128
,
77
8
Y
ear Ended December 31
,
(As a percentage o
f
net revenues
)
201
4
201
3
201
2
N
et revenues
100
.
0% 100
.
0% 100
.
0%
Cost of goods sold
5
1.0
5
1.3
5
2.
1
G
ross pro
fi
t 49.0 48.7 47.9
S
ellin
g
,
g
eneral and administrative expenses 37.5 37.3 36.
5
Income from o
p
erations 11.
5
11.4 11.
4
I
nterest ex
p
ense, net
(0
.
2) (0
.
1) (0
.
3)
Other ex
p
ense, net (0.2) (0.1) —
Income
b
e
f
ore
i
ncome taxes 11.1 11.2 11.1
Prov
i
s
i
on
f
or
i
ncome taxes 4.4 4.2 4.
1
Net income
6
.7% 7.
0
%7.
0
%
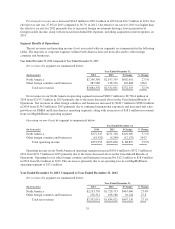
Consolidated Results of Operations
Year Ended December 31, 2014 Compared to Year Ended December 31, 2013
Net revenue
s
i
ncreased $752.3 million, or 32.3%, to $3,084.4 million in 2014 from $2,332.1 million i
n
2013. Net revenues
by
pro
d
uct cate
g
or
y
are summar
i
ze
db
e
l
ow:
Year Ended December
31,
(In thousands
)
2014
2013
$ Chang
e
% Chang
e
App
arel $2,291,520 $1,762,150 $529,370 30.0%
F
ootwear 430,987 298,825 132,162 44.2
A
ccessories 275,425 216,098 59,327 27.5
T
otal net sales 2,997,932 2,277,073 720,8
5
9 31.7
L
icense and other revenues 86,438
5
4,978 31,460
5
7.2
T
otal net revenues $3
,
084
,
370 $2
,
332
,
051 $752
,
319 32.3
%
31