Under Armour 2014 Annual Report Download - page 38
Download and view the complete annual report
Please find page 38 of the 2014 Under Armour annual report below. You can navigate through the pages in the report by either clicking on the pages listed below, or by using the keyword search tool below to find specific information within the annual report.-
 1
1 -
2
-
3
-
4
-
5
-
6
-
7
-
8
-
9
-
10
-
11
-
12
-
13
-
14
-
15
-
16
-
17
-
18
-
19
-
20
-
21
-
22
-
23
-
24
-
25
-
26
-
27
-
 28
28 -
 29
29 -
 30
30 -
 31
31 -
 32
32 -
 33
33 -
 34
34 -
 35
35 -
 36
36 -
 37
37 -
 38
38 -
 39
39 -
 40
40 -
 41
41 -
 42
42 -
 43
43 -
 44
44 -
 45
45 -
 46
46 -
 47
47 -
 48
48 -
49
-
50
-
51
-
52
-
53
-
54
-
55
-
56
-
57
-
58
-
59
-
60
-
61
-
62
-
63
-
64
-
65
-
66
-
67
-
68
-
69
-
70
-
71
-
72
-
73
-
74
-
75
-
76
-
77
-
78
-
79
-
80
-
81
-
82
-
83
-
84
-
85
-
86
-
87
-
88
-
89
-
90
-
91
-
92
-
93
-
94
-
95
-
96
-
97
-
98
-
99
-
100
-
101
-
102
-
103
-
104
 |
 |

I
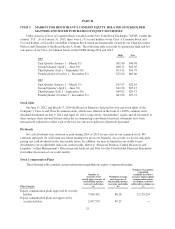
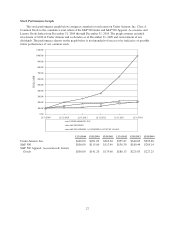
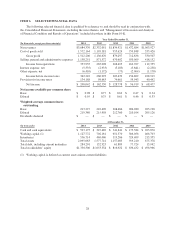
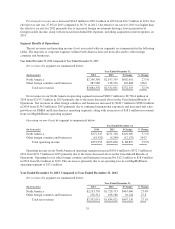
TEM 6.
S
ELE
C
TED FINAN
C
IAL DATA
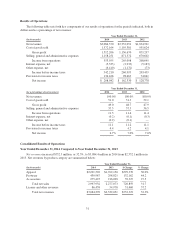
The following selected financial data is qualified by reference to, and should be read in conjunction with,
the Consolidated Financial Statements, including the notes thereto, and “Management’s Discussion and Analysis
o
f Financial Condition and Results of O
p
erations” included elsewhere in this Form 10-K
.
Y
ear Ended December
31,
(
In t
h
ousan
d
s, exce
p
t
p
er s
h
are amounts
)
2
0
14
2
01
3
2
0
1
2
2
0
11
20
1
0
Net revenues
$
3,084,370
$
2,332,051
$
1,834,921
$
1,472,684
$
1,063,927
Cost of goods sold 1,
5
72,164 1,19
5
,381 9
55
,624 7
5
9,848
5
33,420
Gross profit 1,512,206 1,136,670 879,297 712,836 530,507
Sellin
g
,
g
eneral and administrative expenses 1,158,251 871,572 670,602 550,069 418,152
I
ncome from operations 353,955 265,098 208,695 162,767 112,355
Interest expense, net (5,335) (2,933) (5,183) (3,841) (2,258
)
Other expense, net (
6
,410) (1,172) (73) (2,0
6
4) (1,178
)
I
ncome before income taxes 342,210 260,993 203,439 1
5
6,862 108,91
9
Provision for income taxes 134,168 98,663 74,661
5
9,943 40,442
N
et income
$
208
,
042
$
162
,
330
$
128
,
778
$
96
,
919
$
68
,
47
7
Net
i
ncome ava
i
lable per common share
B
asic
$
0.98
$
0.77
$
0.62
$
0.47
$
0.34
Diluted
$
0.95
$
0.75
$
0.61
$
0.46
$
0.33
We
i
ghted average common shares
o
utstand
i
n
g
B
asic 213
,
227 210
,
696 208
,
686 206
,
280 203
,
19
0
Diluted 219
,
380 21
5,
9
5
8 212
,
760 210
,
104 20
5,
12
6
Dividends declared
$
—
$
—
$
—
$
—
$
—
A
t December 31
,
(
In t
h
ousan
d
s
)
2014
2
01
3
201
2
2011
2
010
Cash and cash equivalents
$
593,175
$
347,489
$
341,841
$
175,384
$
203,87
0
W
orking capital (1) 1,127,772 702,181 651,370 506,056 406,70
3
Inventories 536
,
714 469
,
006 319
,
286 324
,
409 215
,
355
T
otal assets 2
,
095
,
083 1
,
577
,
741 1
,
157
,
083 919
,
210 675
,
37
8
T
otal debt, including current maturities 284,201 152,923 61,889 77,724 15,94
2
T
otal stockholders’ equity
$
1,350,300
$
1,053,354
$
816,922
$
636,432
$
496,96
6
(1) Wor
ki
ng cap
i
ta
li
s
d
e
fi
ne
d
as current assets m
i
nus current
li
a
bili
t
i
es.
28